This example illustrates how VTS Analytics can support the recruitment process for commercial airline pilots.
You are a psychologist working for an airline and are responsible for recruiting 20 new commercial pilots. The application period begins on October 1st and initially lasts three months. Preselected candidates are invited to complete the SFS Test Solution Airline Pilots (Screening Form) as part of the online screening process.
Monitoring the Application Phase
During the application period, you regularly monitor how many candidates have completed testing. To do so, you navigate to Tests - Overview in VTS Analytics and set the filters so that only results from the test battery Airline Pilots (Screening Form) are included.
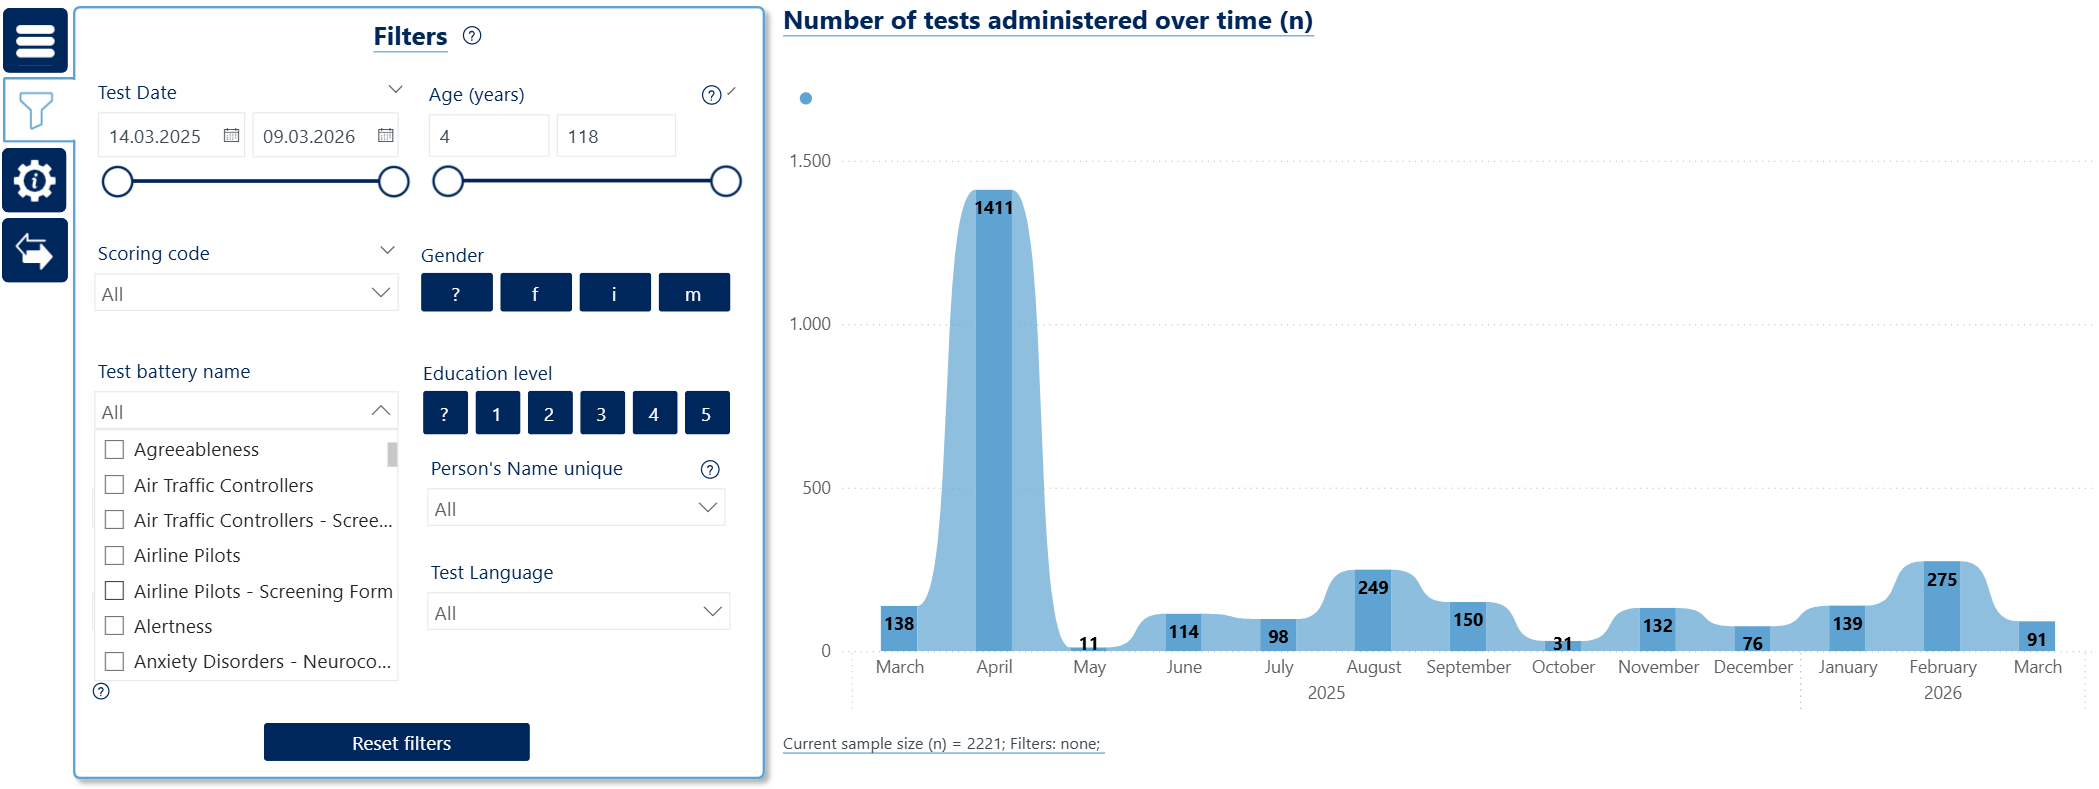
After two months, you observe that 49 candidates have completed the testing in VTS Online.
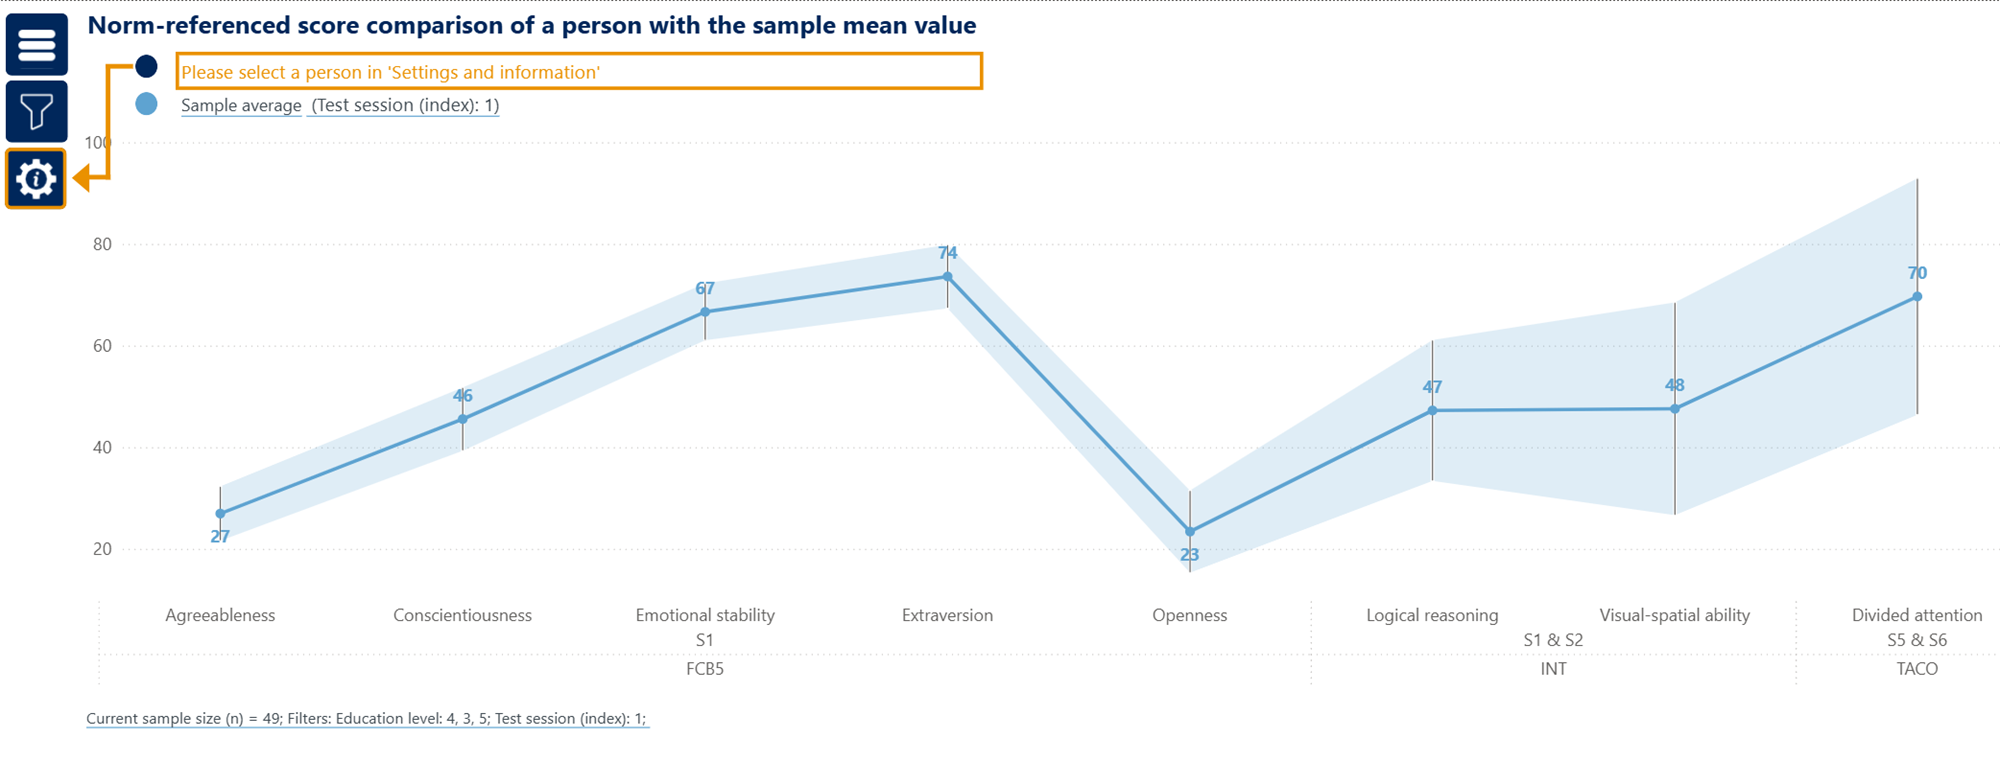
To better understand the performance level of the current applicant pool, you next navigate to Results - Comparison with average. After activating confidence intervals, you review the average performance across all candidates. You notice that the average score in Logical Reasoning is approximately at the population average.
Given that only candidates scoring above a cut-off of percentile rank 75 relative to the representative norm sample will be considered for the next stage, this suggests that a substantial proportion of the current applicant pool may not meet the predefined selection criterion.
Adjusting the Recruitment Strategy (Targeted Recruitment)
Based on this observation, you decide to extend the application period by another two months in order to ensure that a sufficient number of candidates remain after the expected screening dropout rate of approximately 30%.
While reviewing the data, you also notice that only one of the applicants is a woman, resulting in a very uneven gender distribution. This may be relevant with regard to requirements for gender representation. The data may therefore serve as a basis for reviewing the current recruitment strategy and approach to the target group.
After the extended recruitment period, you review the testing data again. Using Tests - Overview, you explore the data and open Interactive Highlighting to investigate whether the targeted advertising campaign had the intended effect.
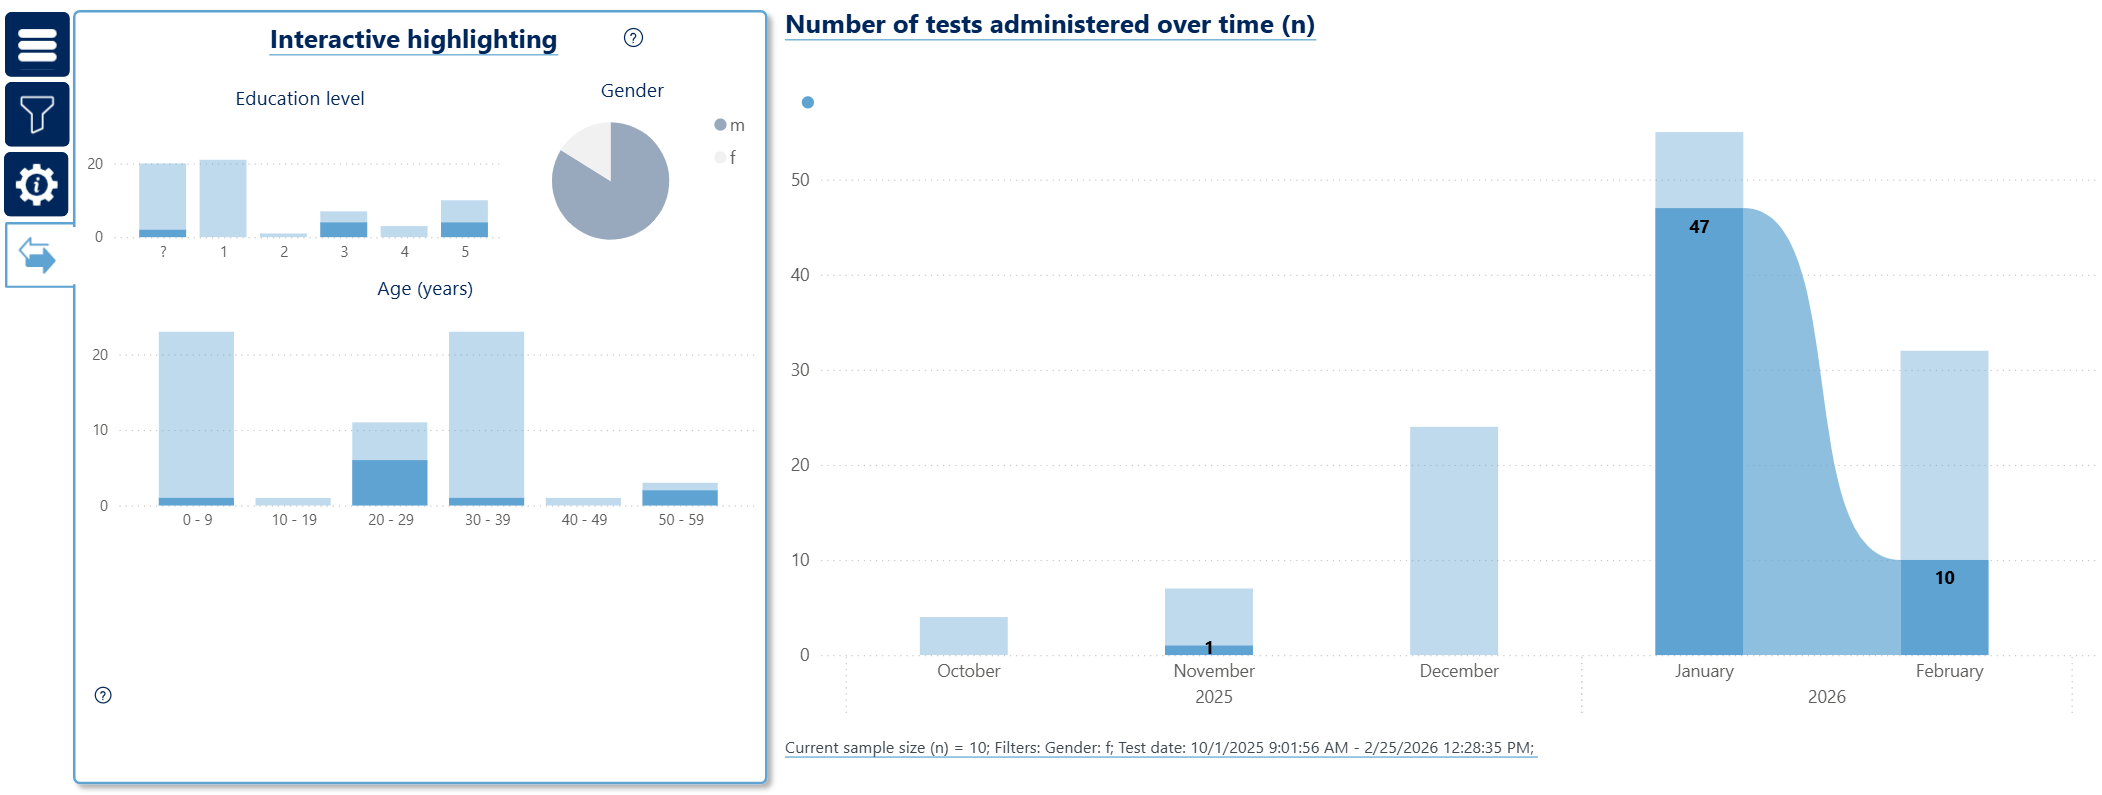
You observe that the gender composition of the applicant pool has become more balanced.
To verify this observation in more detail, you navigate to Distributions - Sample. Here you examine the distributions of gender, age, and education level within the applicant sample.
Preparing and Evaluating the On-Site Assessment
Before proceeding with the selection process, you also examine the data for possible irregularities. On the Distributions - Distributions page, you use cross-highlighting to compare test duration with the distribution of test scores.
This analysis reveals one candidate who consistently achieved maximum scores while also showing one of the shortest test durations. To investigate further, you open the candidate’s detailed test results in VTS Online and review their item-level performance. You notice that the working time per page is consistently five seconds, which suggests that the test may not have been completed under valid conditions. You therefore decide to address this observation during the candidate’s in-person interview.
At the end of the recruitment phase, you have 100 applicants, 58 of whom are women. These candidates are invited to participate in the on-site assessment, which includes the SFS Test Solution Airline Pilots (Standard Form) as well as a structured in-person interview.
After the on-site testing has been completed, you analyze the results in VTS Analytics. By navigating to Tests - Overview and filtering the data for the test battery Airline Pilots (Standard Form) and the relevant on-site testing dates, you observe a response rate of 70%.
To identify candidates who meet the minimum cognitive requirements, you navigate to Results - Overview and sort the results by Logical Reasoning. You then determine which candidates achieved a norm-referenced score above percentile rank 75. This results in 32 candidates who meet the predefined cutoff. Using the Filters panel, you select these individuals via Person name (unique) in order to review the final candidate pool.
Preparing the Final Interviews
Before making final decisions, you verify the demographic composition of the selected candidates using Distributions - Sample. The final pool consists of 17 women and 14 men, and all candidates meet the predefined requirements for education level and age.
To obtain a clearer picture of each candidate’s performance profile, you open Results - Comparison with average . By filtering for gender and selecting individual candidates in the Settings panel, you can compare each candidate’s results with the average performance of their respective gender group.
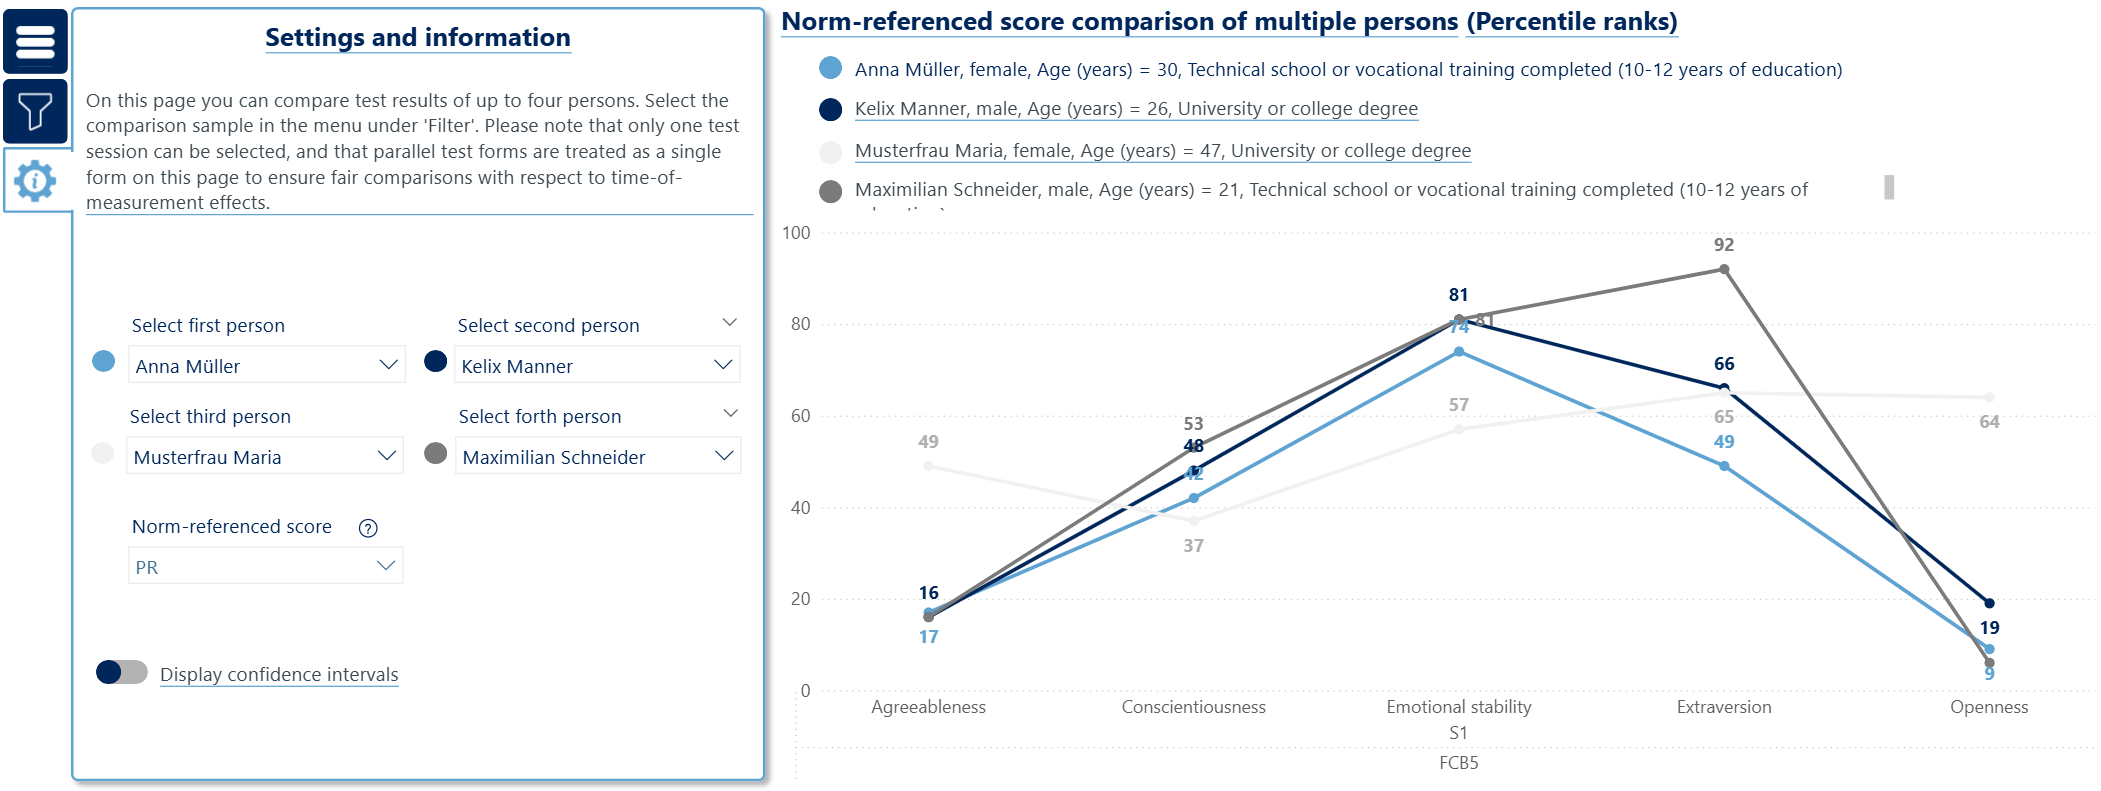
After gaining a more detailed understanding of each candidate’s strengths and weaknesses, you proceed to Results - Comparison of persons to directly compare the top candidates across multiple psychological traits.
For the final interviews, you prepare an overview of each candidate’s performance relative to the sample average of their gender group using Results - Comparison with average again. This allows you to quickly assess how each candidate’s psychological traits compare with the reference group.
Abilities are interpreted using confidence intervals, taking test reliability into account. In this context, a candidate’s ability can be considered above average when the individual confidence interval overlaps with the sample mean confidence interval.
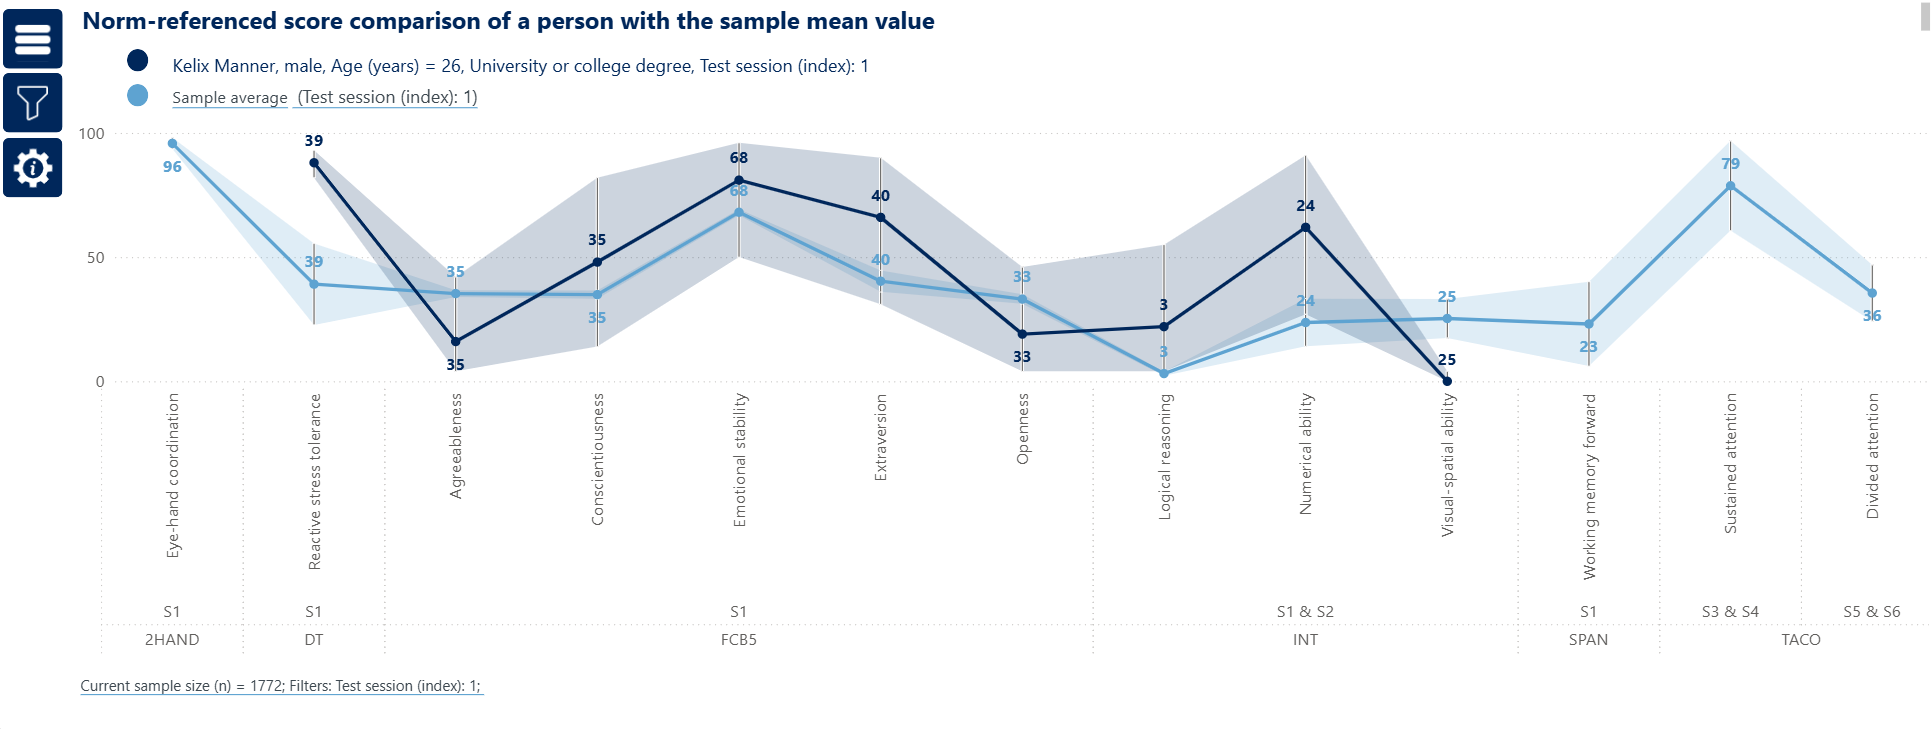
In the example shown, the candidate demonstrates above-average reactive stress tolerance, while their visuo-spatial ability falls below the sample average. The comparisons are based on T-scores - norm-referenced score type can be set under “Settings” - ensure statistically appropriate calculations of the sample mean and allow reliable comparisons between candidates.