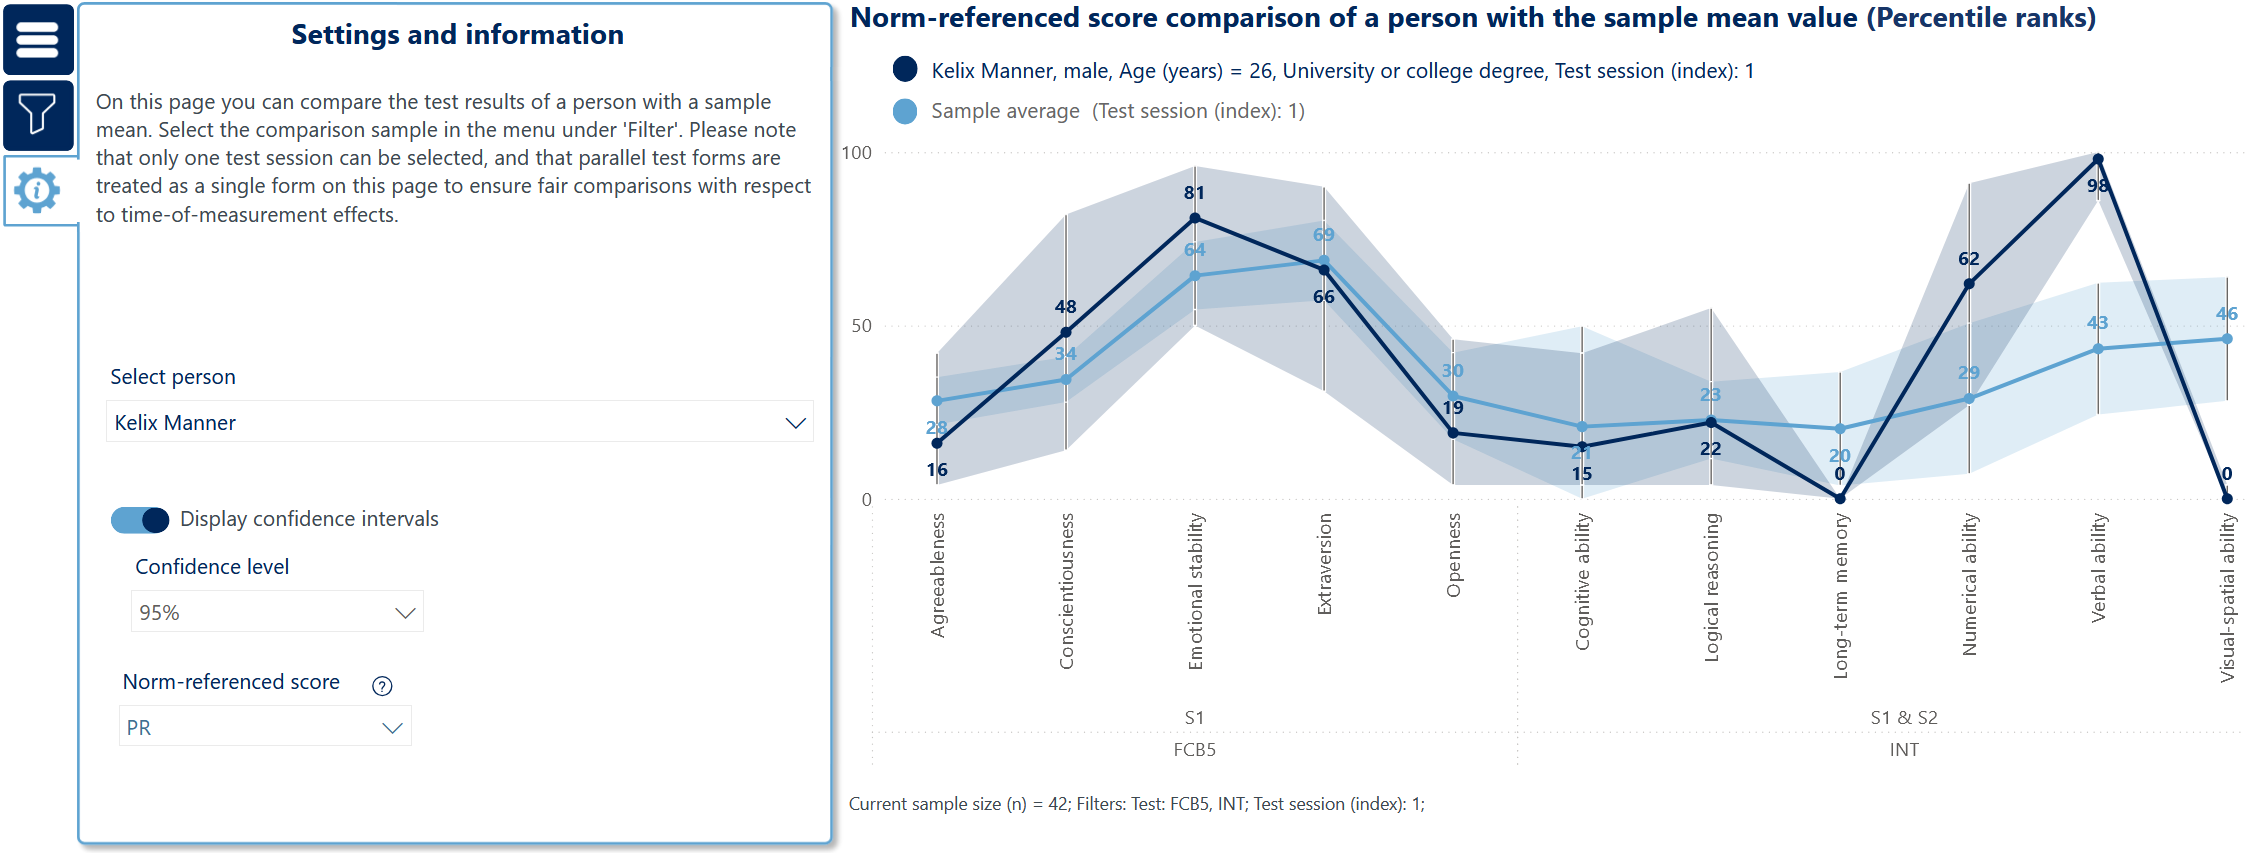
On this page, you can compare a test person to a sample mean. The sample mean can be set irrespective if the person is part of that sample (e. g. compare a women to a men-only sample mean).
You have to select one person in “Settings and information” to display person-level data.
Confidence interval of the sample mean
The confidence interval of the sample mean is calculated as
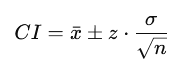
where
-
x is the sample mean
-
z is the critical value corresponding to the selected confidence level
-
σ is the standard deviation
-
n is the sample size
If n < 3, the confidence interval is not displayed.
The user chooses z from the available confidence levels:
|
Confidence level |
z |
α |
|---|---|---|
|
68% |
1.000 |
0.32 |
|
80% |
1.282 |
0.20 |
|
90% |
1.645 |
0.10 |
|
95% (default) |
1.960 |
0.05 |
|
99% |
2.576 |
0.01 |
The bounds of the norm-referenced score confidence intervals are restricted depending on the score type, for percentile ranks 0 ≤ CI ≤ 100, and for T scores, IQ scores, and Z scores −3σ ≤ CI ≤ +3σ with
|
Score scale |
Mean (μ) |
Standard deviation (σ) |
|---|---|---|
|
Z score |
100 |
10 |
|
T score |
50 |
10 |
|
IQ score |
100 |
15 |