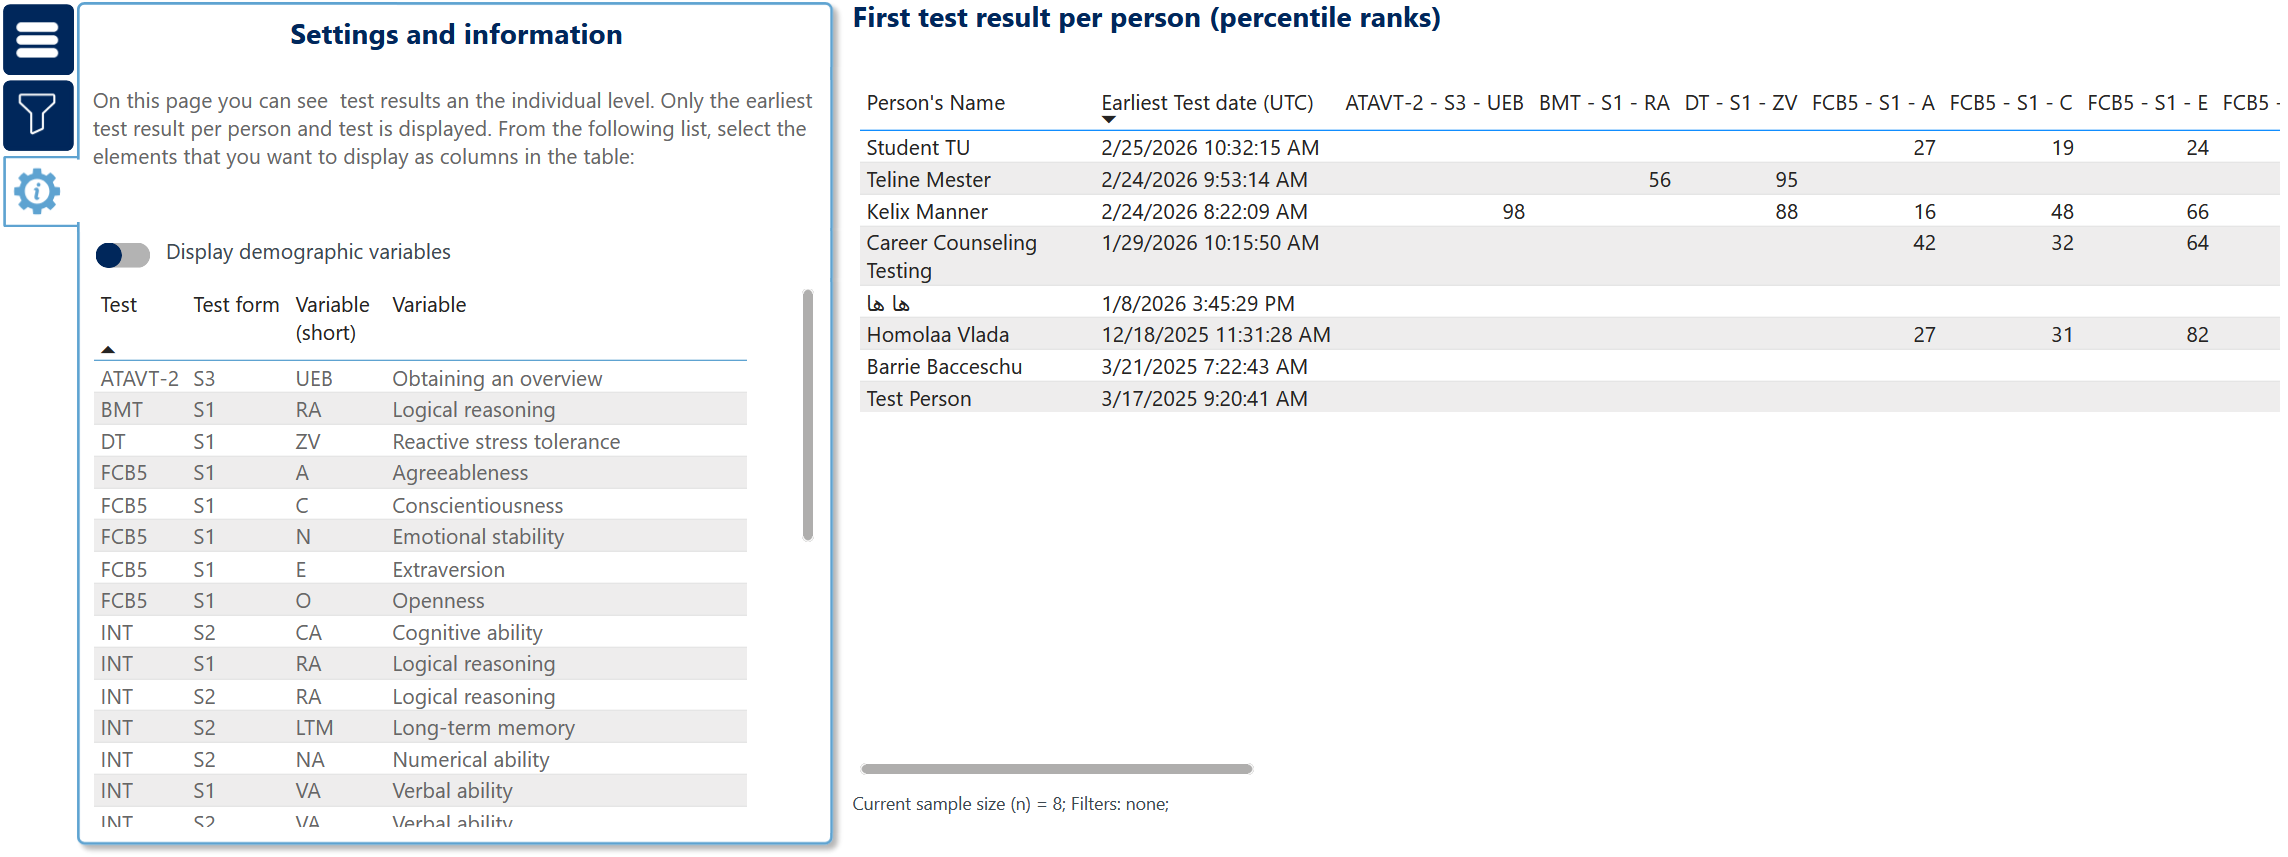
On this page, you can see the first test result of each person. By clicking on the table in “Settings and information” you can dynamically cross-filter the visual. Use “Display demographic variables” to add Gender, Age, and Education to the table.
On this page, you can see the first test result of each person. By clicking on the table in “Settings and information” you can dynamically cross-filter the visual. Use “Display demographic variables” to add Gender, Age, and Education to the table.