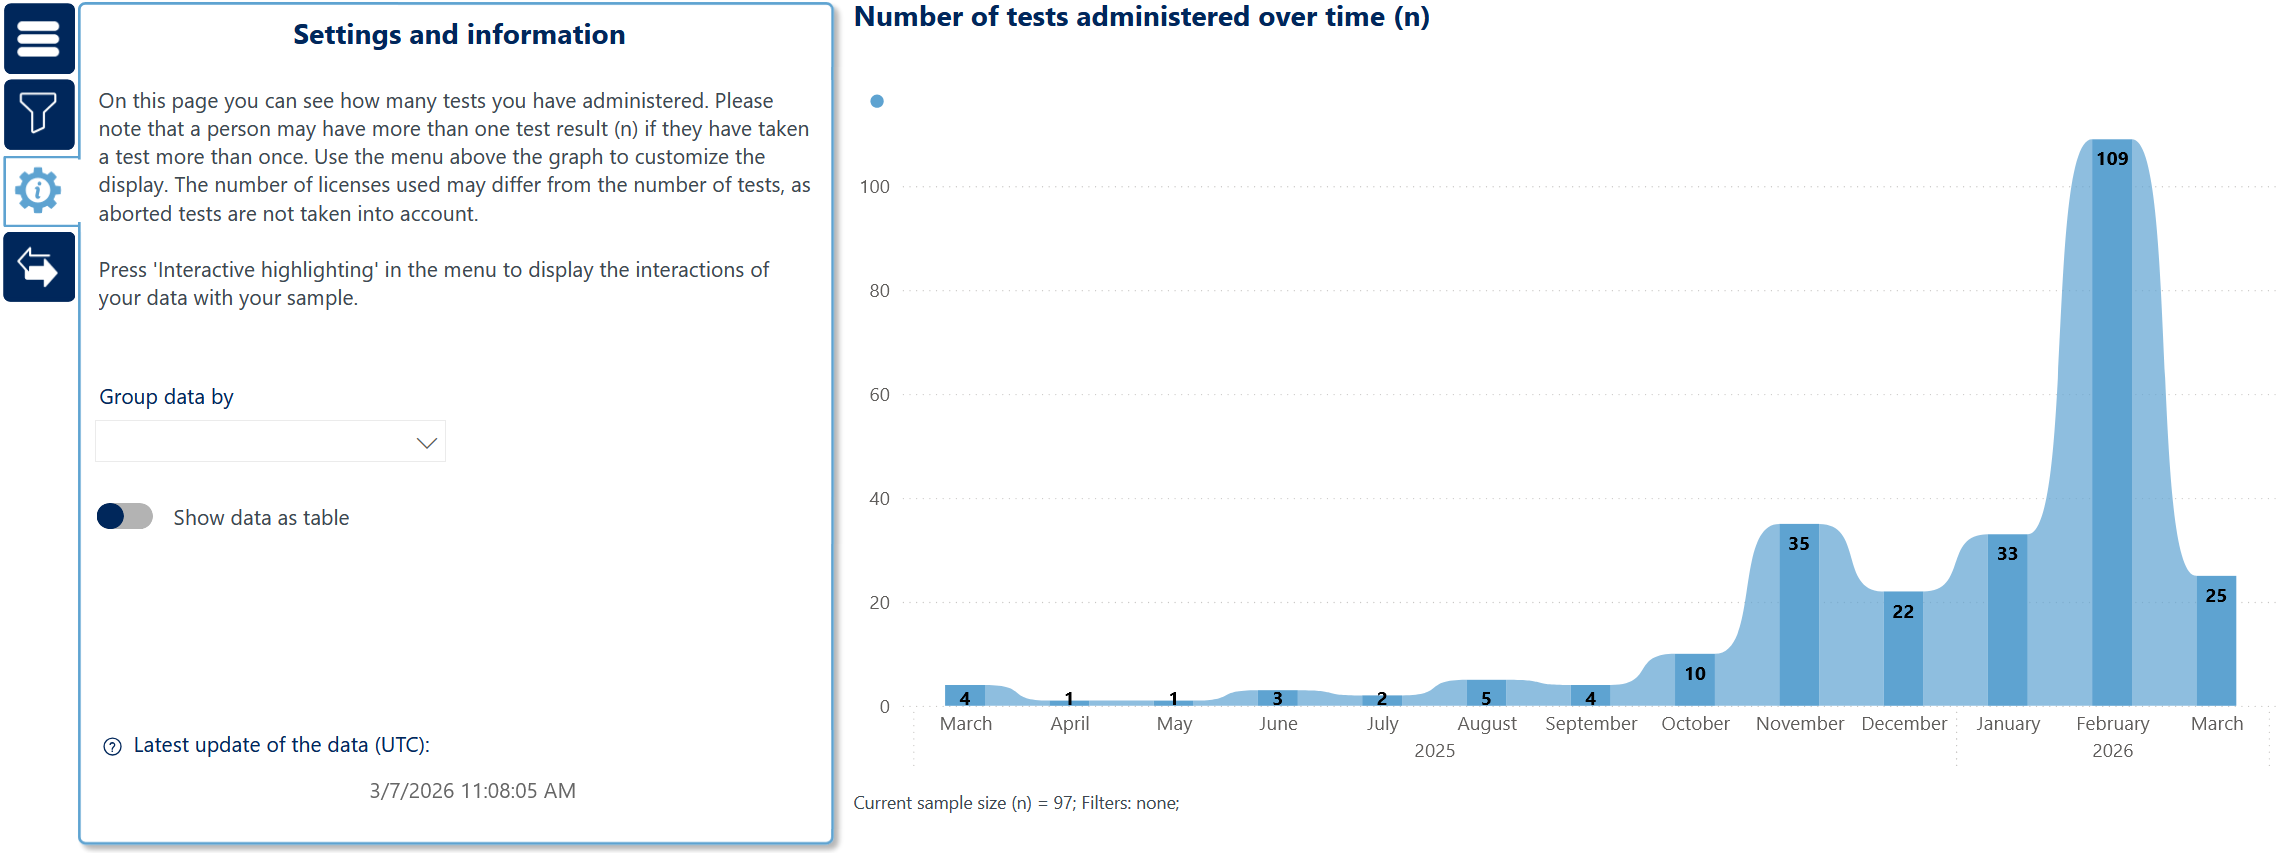
On this page you can monitor how much you’re testing. Use the “Group data by” dropdown and “Show as table” toggle to adjust the visual.
Interactive highlighting ( 
Also, you can find the latest data update of the data processing from VTS Online on this page.