In the Create results report tab, you can customize the appearance of your report. You can add different report elements (profile, result table, test protocol, variable description) to your results report. At the top right of each area, you will find a symbol in the form of a question mark. If you hover over this symbol, you will see a preview of what the respective report element looks like in an example results report. Please note that this preview does not reflect your individual settings, but only provides a general idea of the appearance of the report element.
Result table
The result table report element displays the calculated variables in the form of a table. If you add a result table, you must first add a section to the result table and then add variables to this section. You can create different sections within the table, which you can label for a cleaner structure. In the example from the screenshot below, section 1 is called "Well-being" and section 2 is called "Additional information".
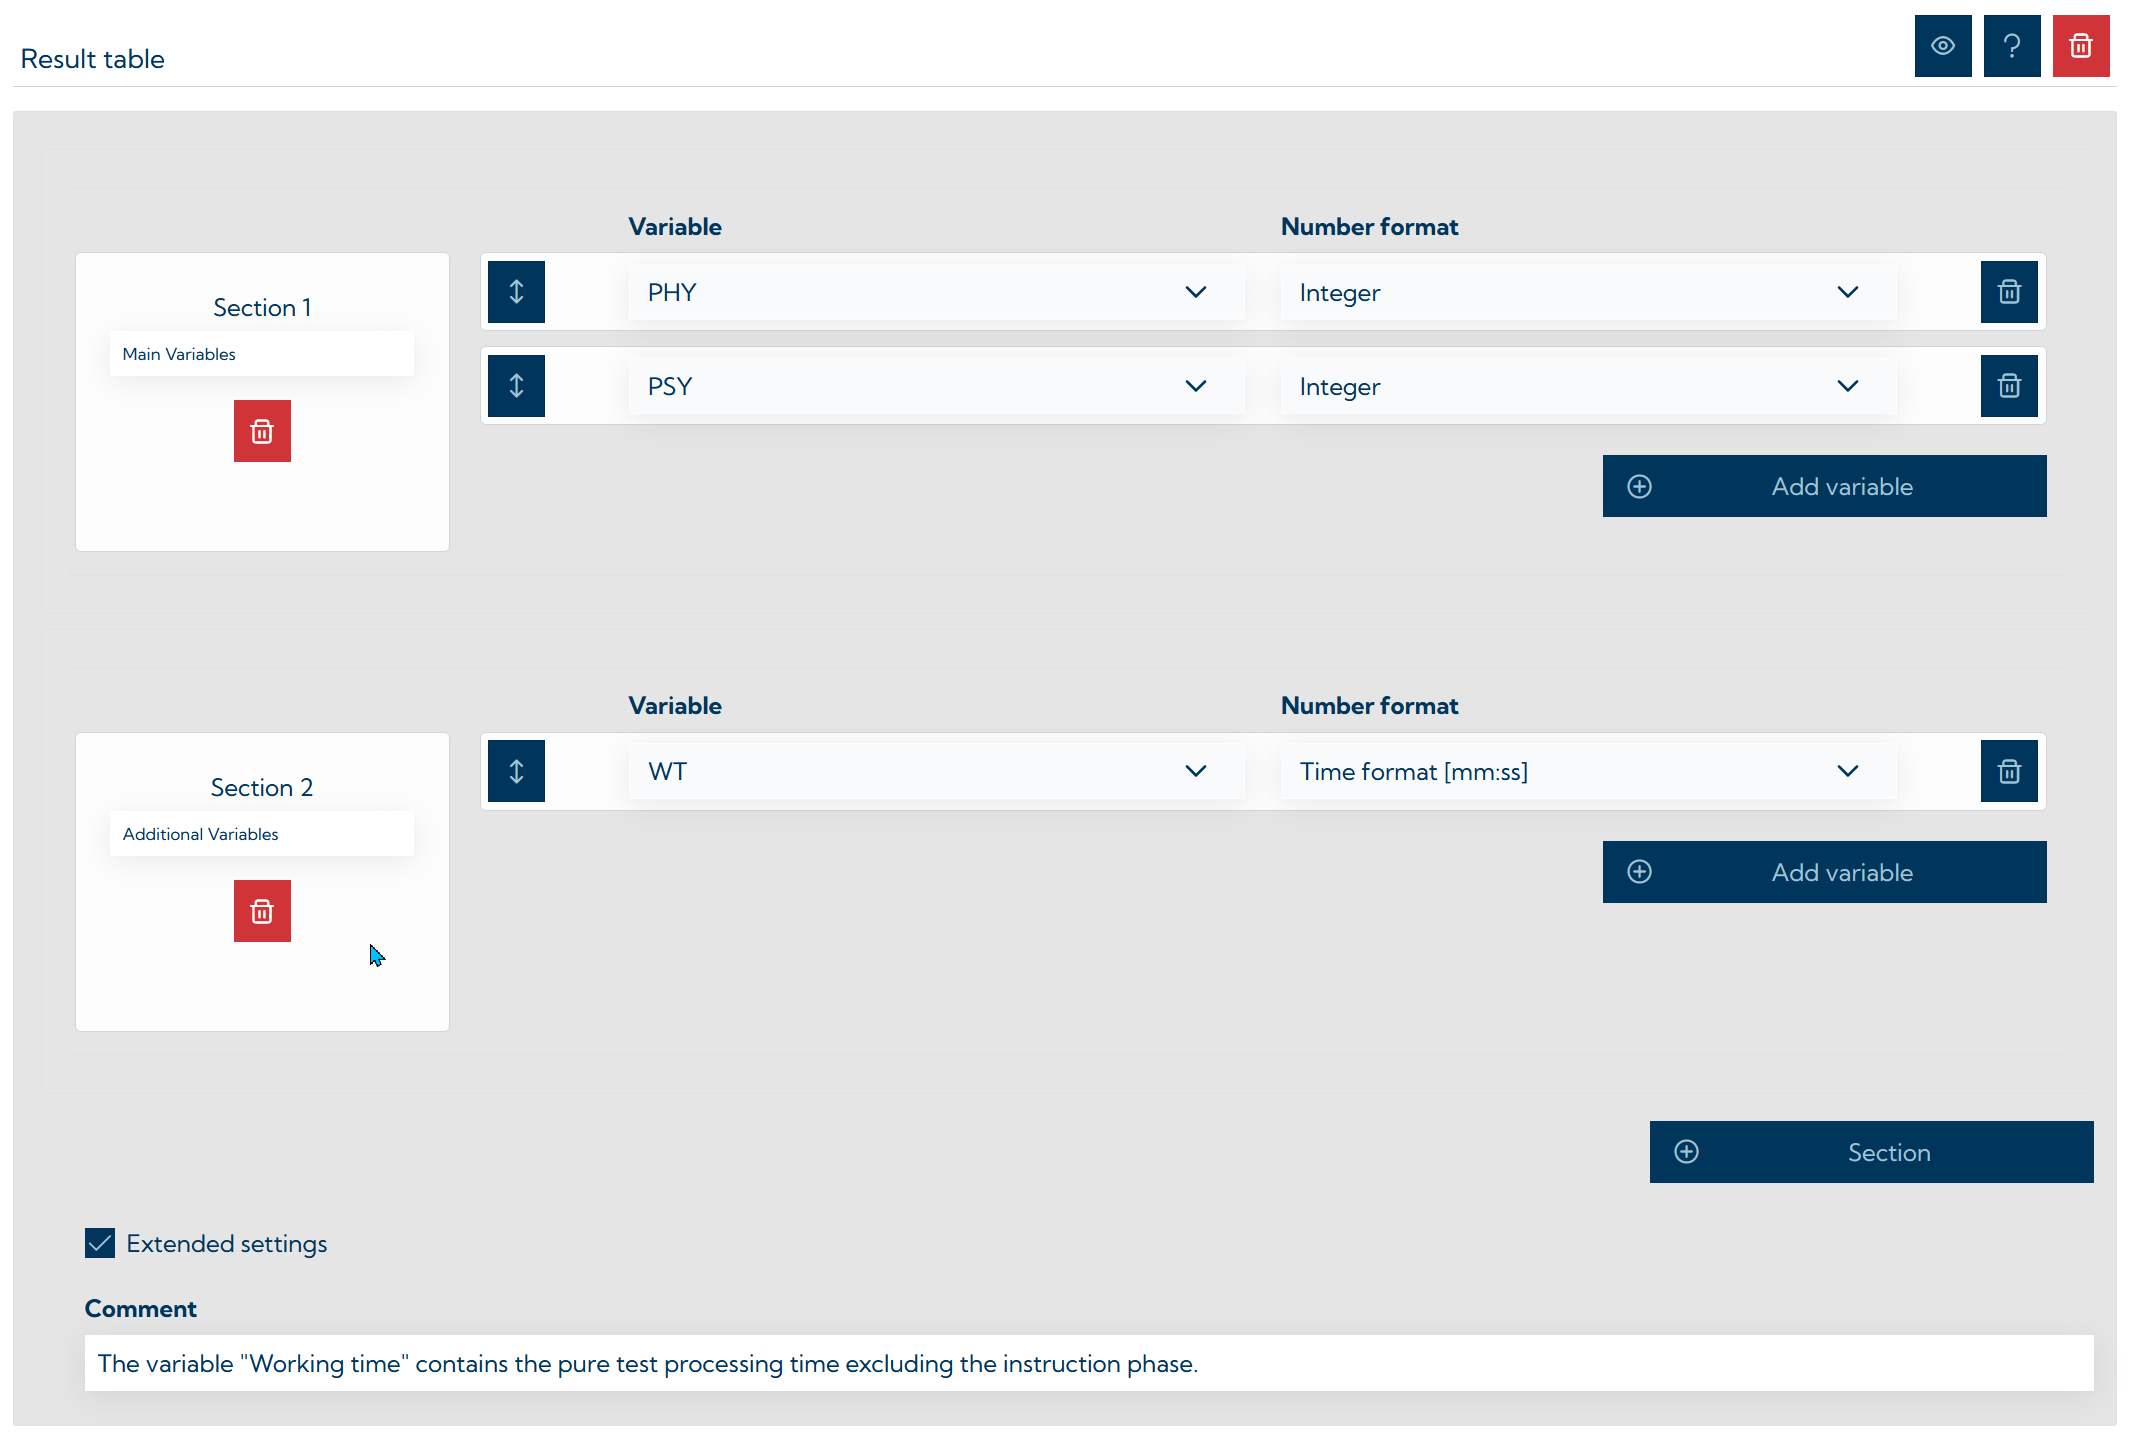
You can customize the display of the variable values in the table by selecting the desired number format (e.g. display as a whole number or with decimal places). You can change the order in which your variables are listed (using drag & drop on the buttons with the arrows). The screenshot below shows how this is displayed in the results report. The displayed name of the variables comes from the Description field on the Set scoring tab.
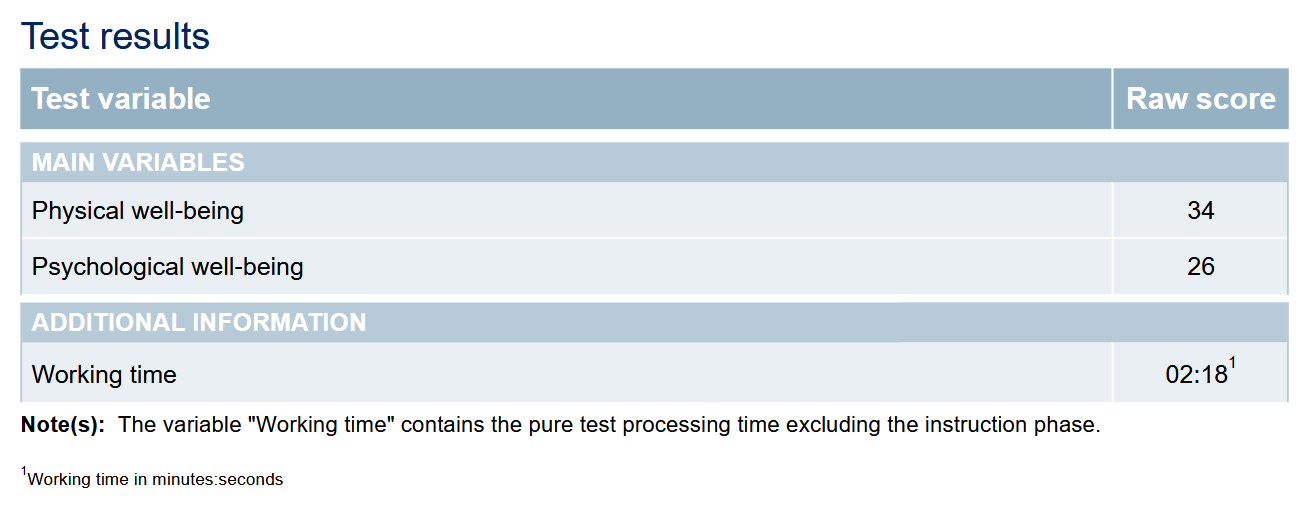
If necessary, you can activate the Extended settings and add a comment, which will be displayed in the results report as a note below the table. This can be used to provide test users with notes on certain variables.
Test protocol
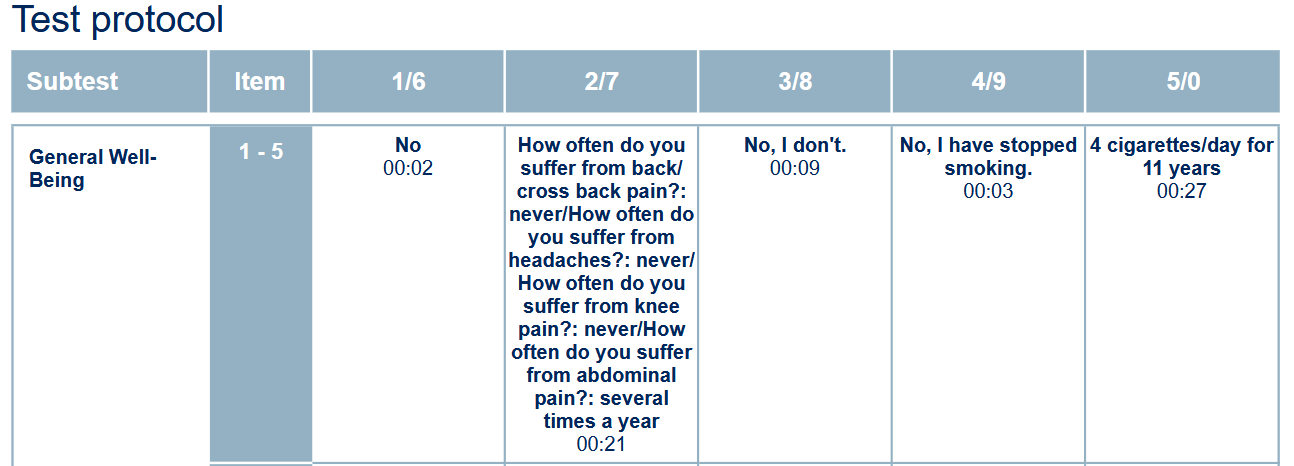
The test protocol report element lists the respondent's entered answer for each test page. In addition, if test pages with correct / incorrect answer options have been defined, it is color-coded whether an answer was correct or incorrect.
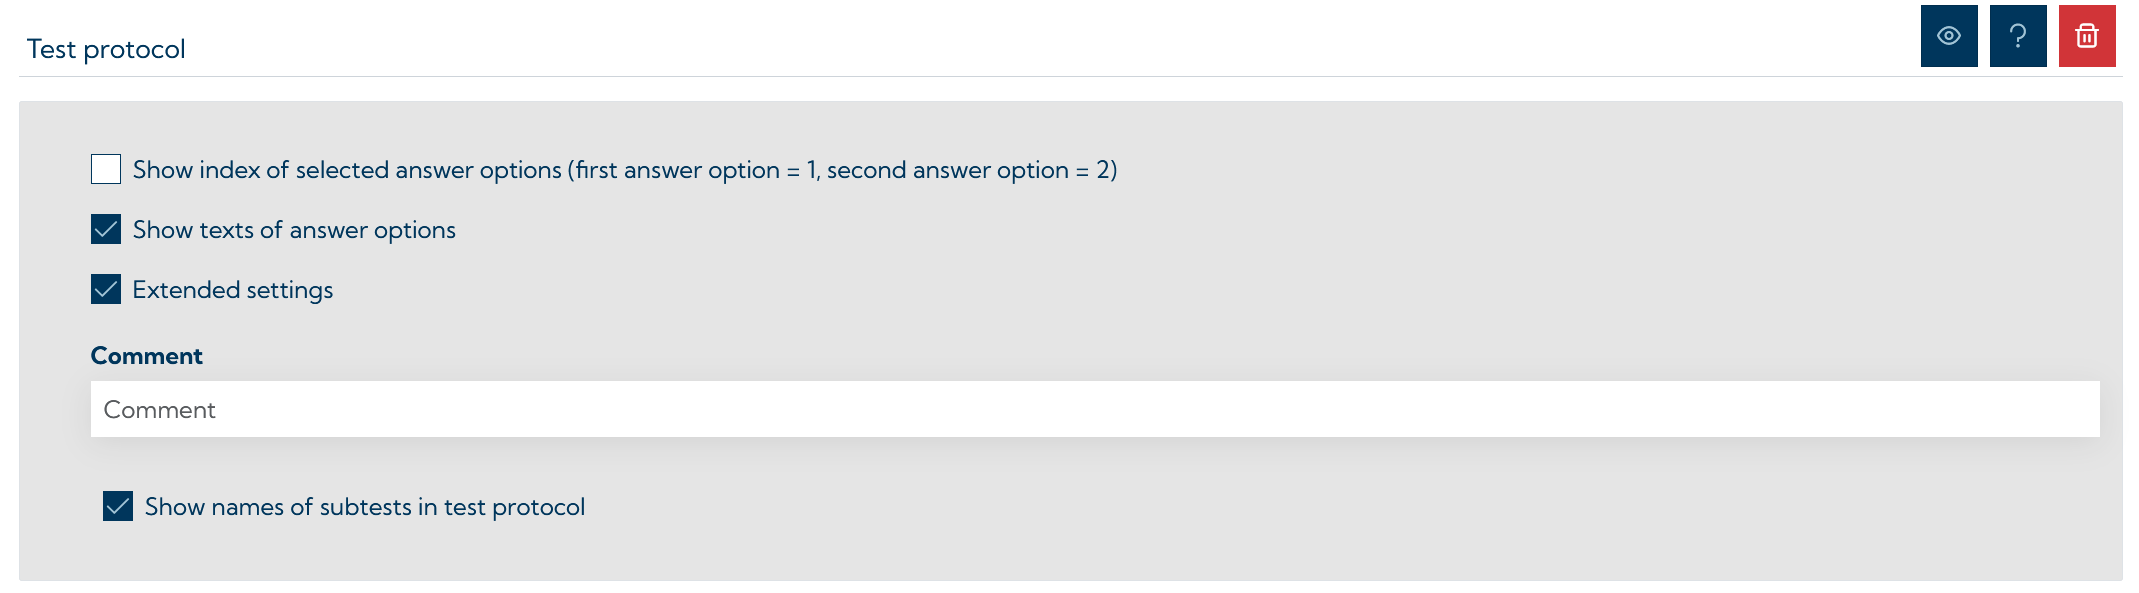
The option "Show index of selected answer options" allows you to display as a number which answer option was selected for each question. For example, if the first answer was selected, a 1 will be displayed.
Select "Show answer option texts" to display the exact text of the given answer option, regardless of whether it was selected from predefined options (e.g. multiple choice or matrix questions) or written by participants in response to open questions. If an answer option "Yes" is available on a single/multiple choice page and this is selected, this is displayed as shown in the screenshot below displayed.
In the extended settings, you can also select whether the names of the subtests should be displayed (in the example from the screenshot below, this option has been activated). You can also add a comment, which is displayed as a note under the test protocol and can, for example, provide notes on the coding of the answers.
Note: When using pages with matrix input, it is recommended that you at least use the “Index of selected answer options” option, as otherwise only a question mark symbol will be displayed in the test protocol.
For a clearer protocol in more complex tests / questionnaires (e. g when using scales) we recommend to use the item analysis protocol (see below) instead.
Variable description
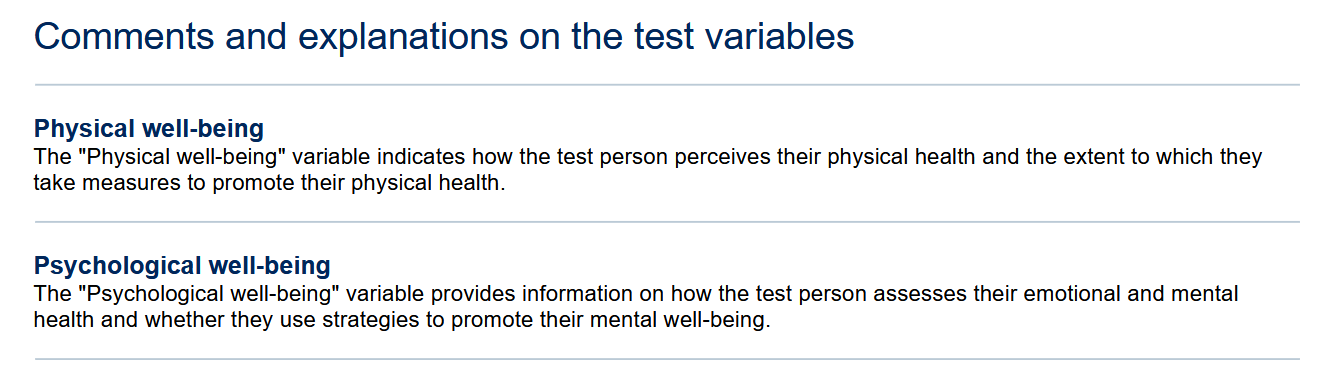
The variable description report element allows you to display explanations (text descriptions) of the variables used in the test in the results report. To do this, add the variables for which you want to provide a description (Add variable --> select variable in the Variable field) and add the corresponding description in the Variable description field.
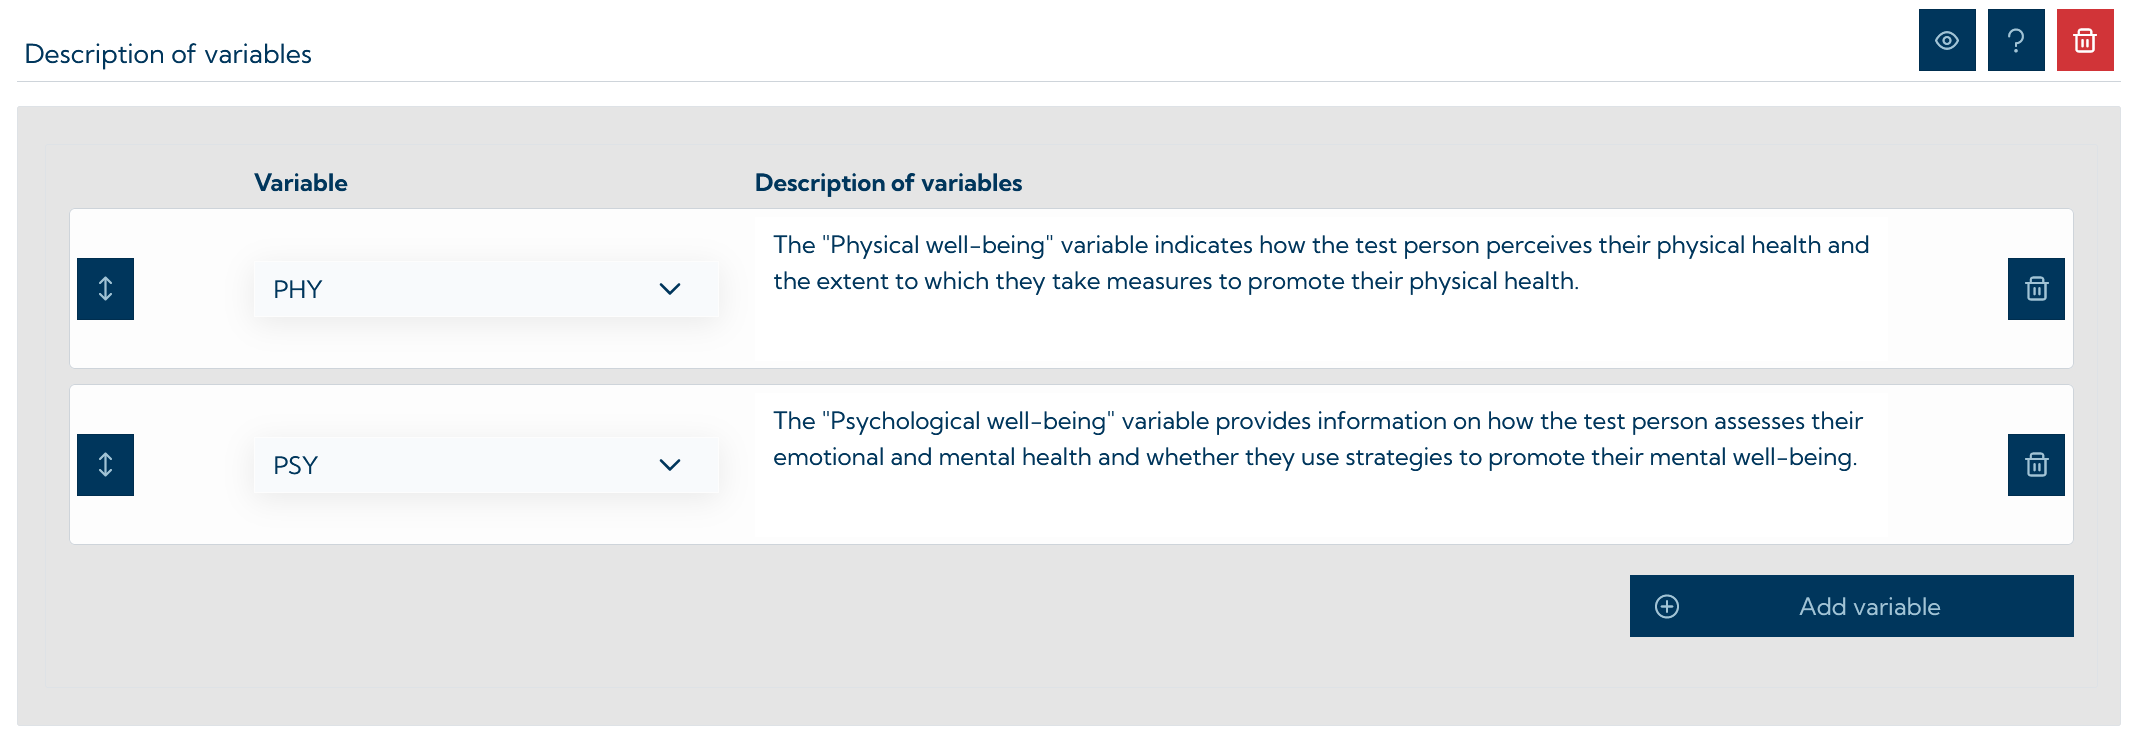
The screenshot below shows how this is presented in the results report.
Profile
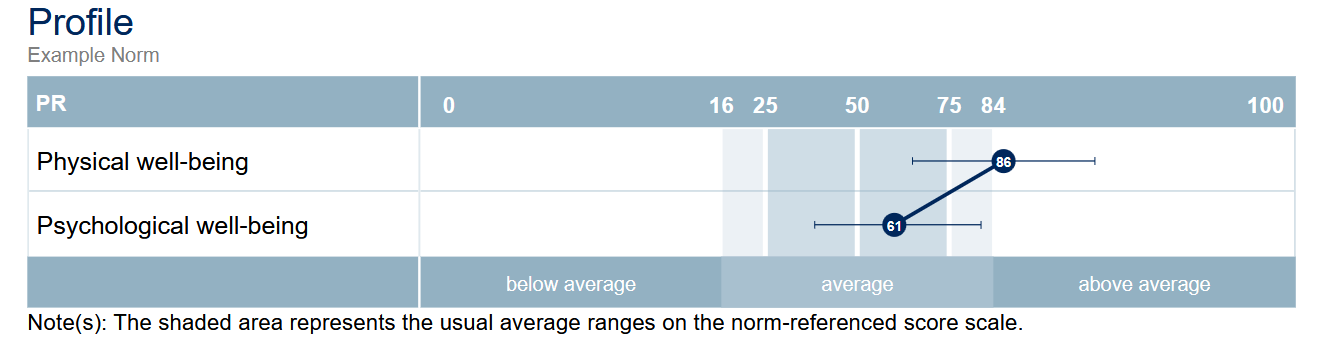
The profile report element graphically displays the norm-referenced scores of the participants. The variable scores are arranged one below the other. A profile can be structured into sections with different labels.
Attention: A profile can only display norm-referenced scores. If no norms have been added to the test, this element remains empty, even if there are raw scores available for the variables. See: Add normson how to add norms to your test / questionnaire.
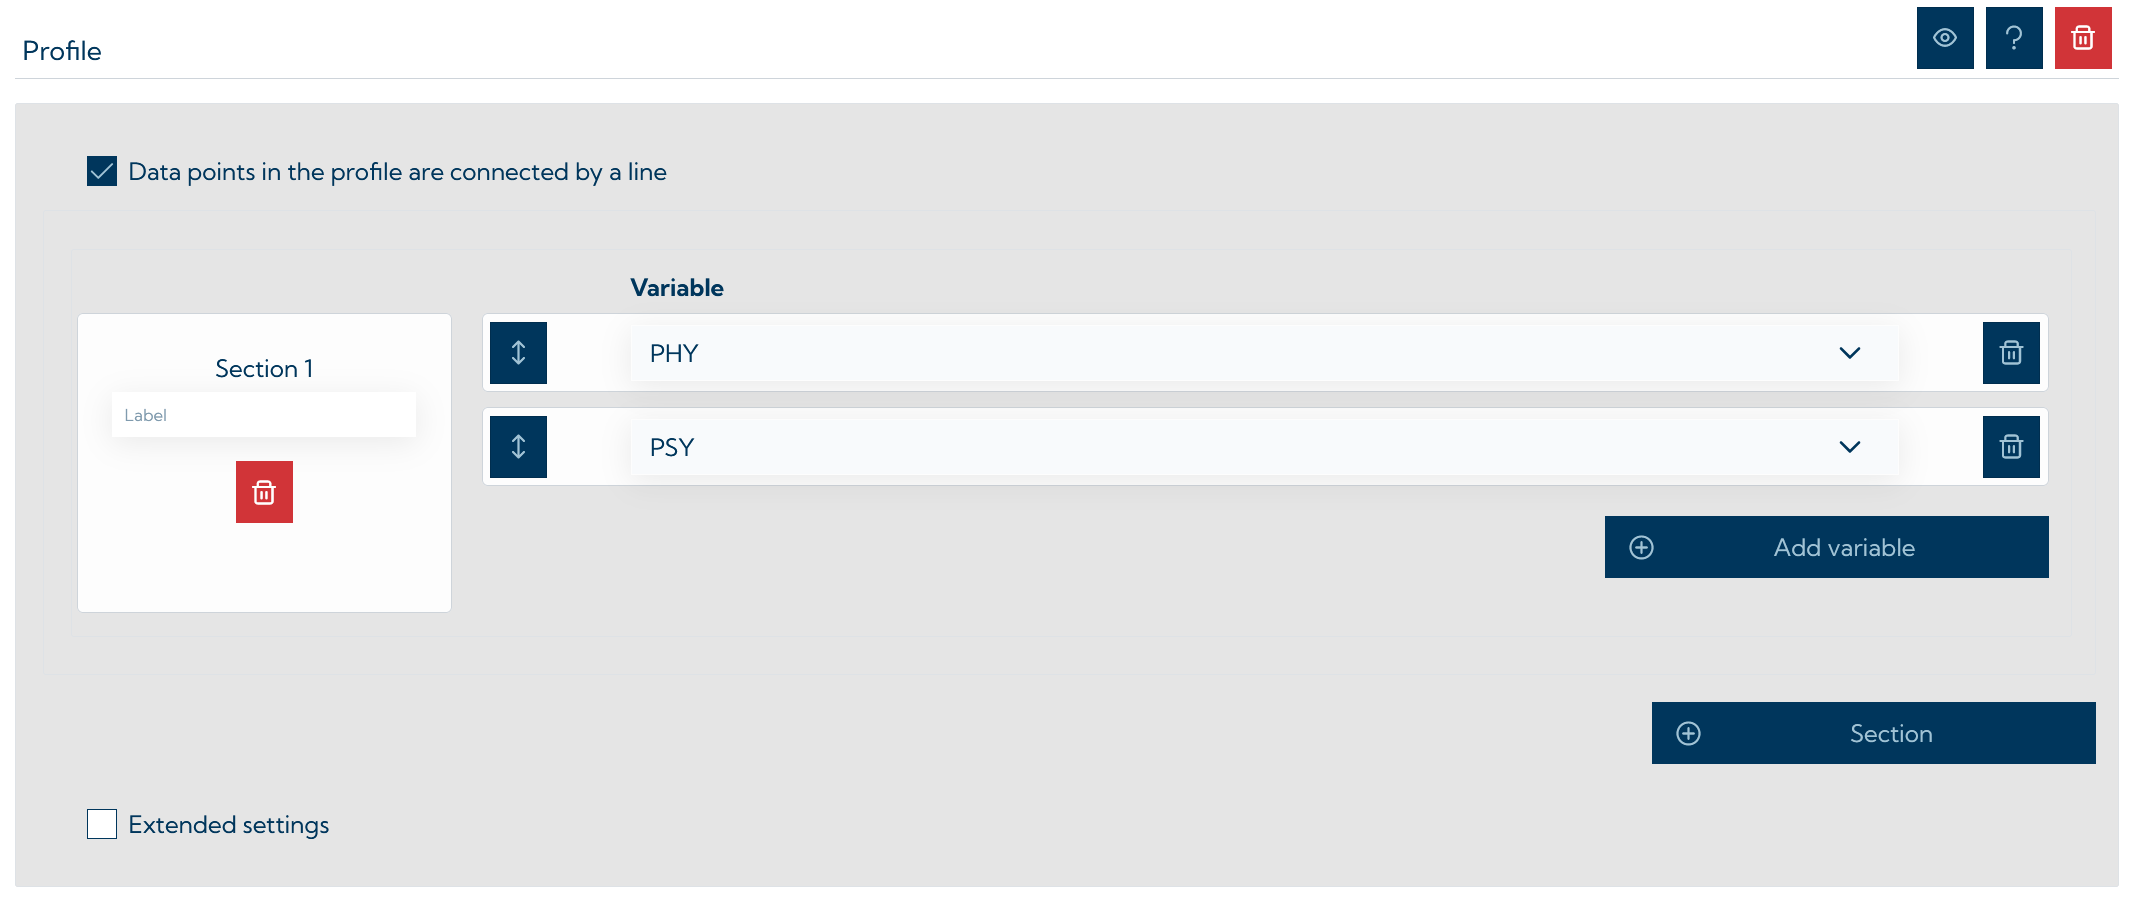
An example of how the profile is presented in the results report can be found in the screenshot below.
Item analysis protocol
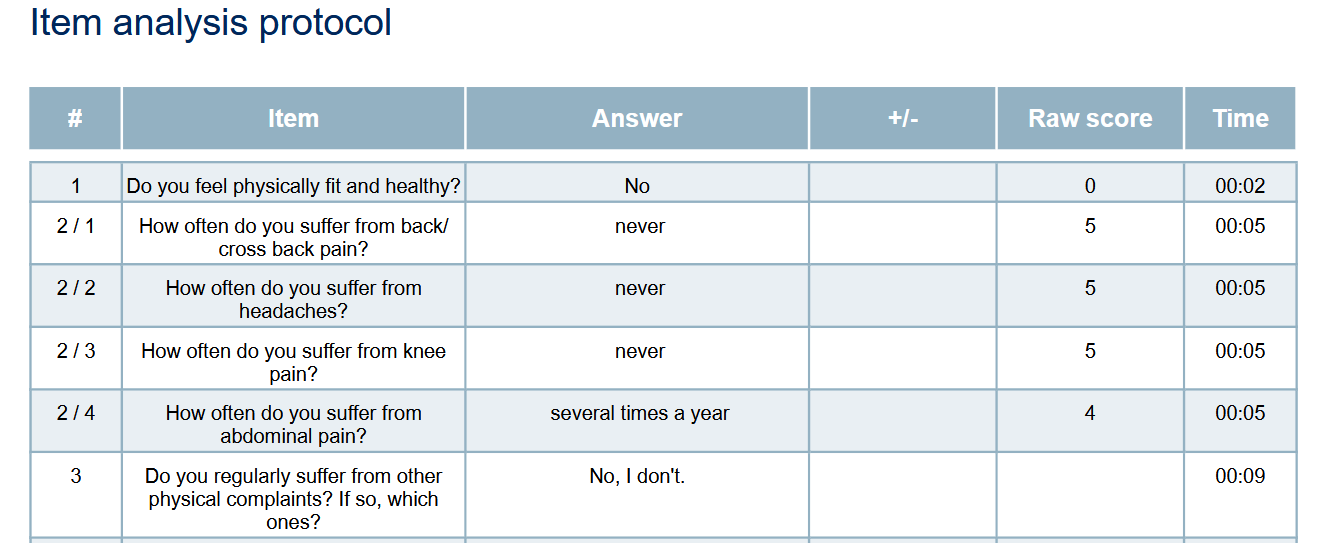
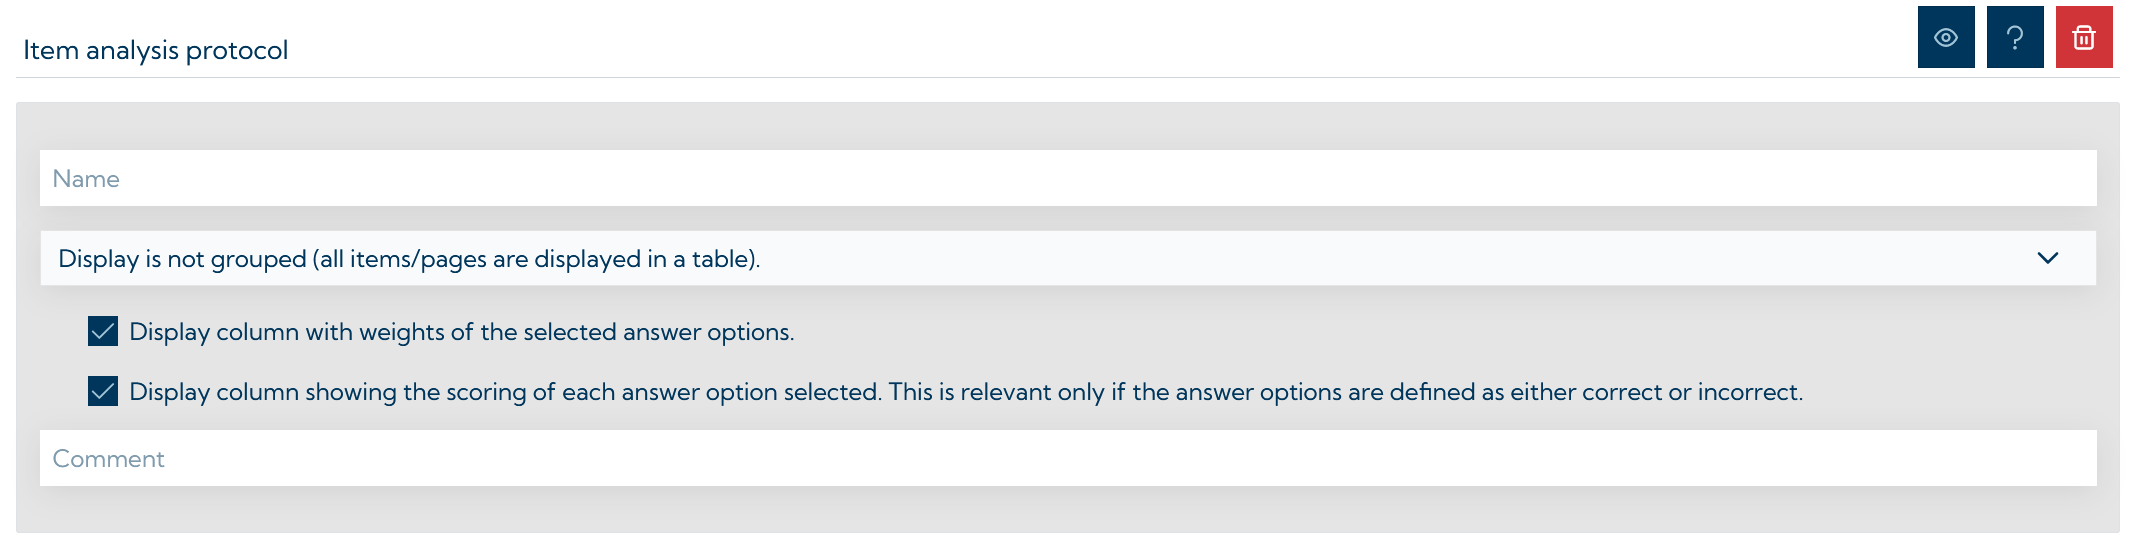
The item analysis protocol report element offers a more detailed version of a test report. Each question is displayed in a row of a table and the selected answer option (or entered answer) is shown. The working time per page is also displayed. If the option “Display column with weights of the selected answer options” is selected in the Test Generator, the “Raw value” column is displayed, which shows the weights of the selected answer option. Weights can only be displayed if they are set under Set scoring (e. g. by using the weighted sum scoring method in one variable).
If the option “Display column with evaluation of the selected answer options” is selected, the “+/-” column is displayed in the item analysis protocol. This indicates whether the item was answered correctly (+) or incorrectly (-). This only works if answer options have also been marked as correct or incorrect.
It is also possible to specify the grouping by selecting the corresponding option in the drop-down menu. All pages of the test can be displayed in a table, a separate table can be output for each scale (if such are defined) or for each subtest (if several are used). The settings are shown as an example in the figure below.
An example of how such an item analysis protocol looks like in the results report can be found in the screenshot below.