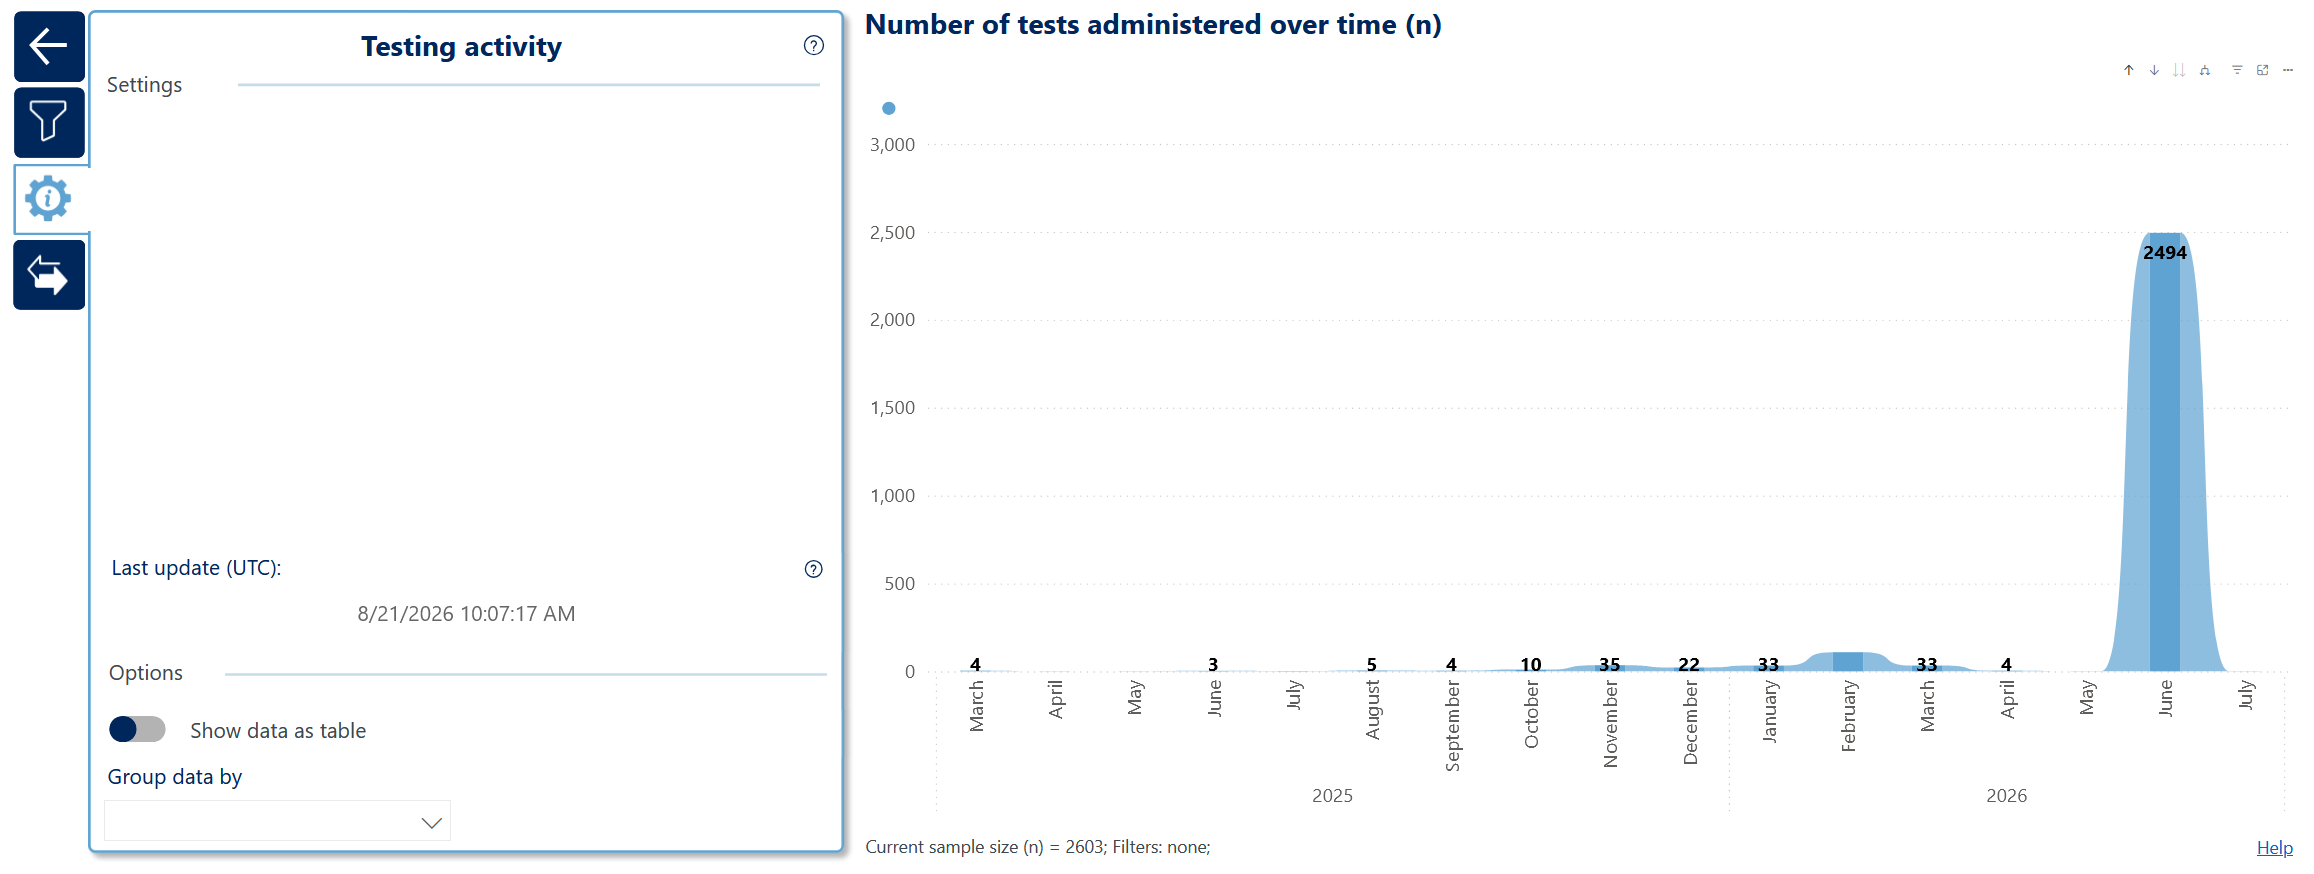
How much and when is being tested?
On this page you can monitor how much you’re testing. Use the Group data by dropdown and Show as table toggle to adjust the visual.
Hover over the visualization and click the up 

Interactive highlighting ( 

How much and when is being tested?
On this page you can monitor how much you’re testing. Use the Group data by dropdown and Show as table toggle to adjust the visual.
Hover over the visualization and click the up
Interactive highlighting (