Has a person's test performance changed over time?
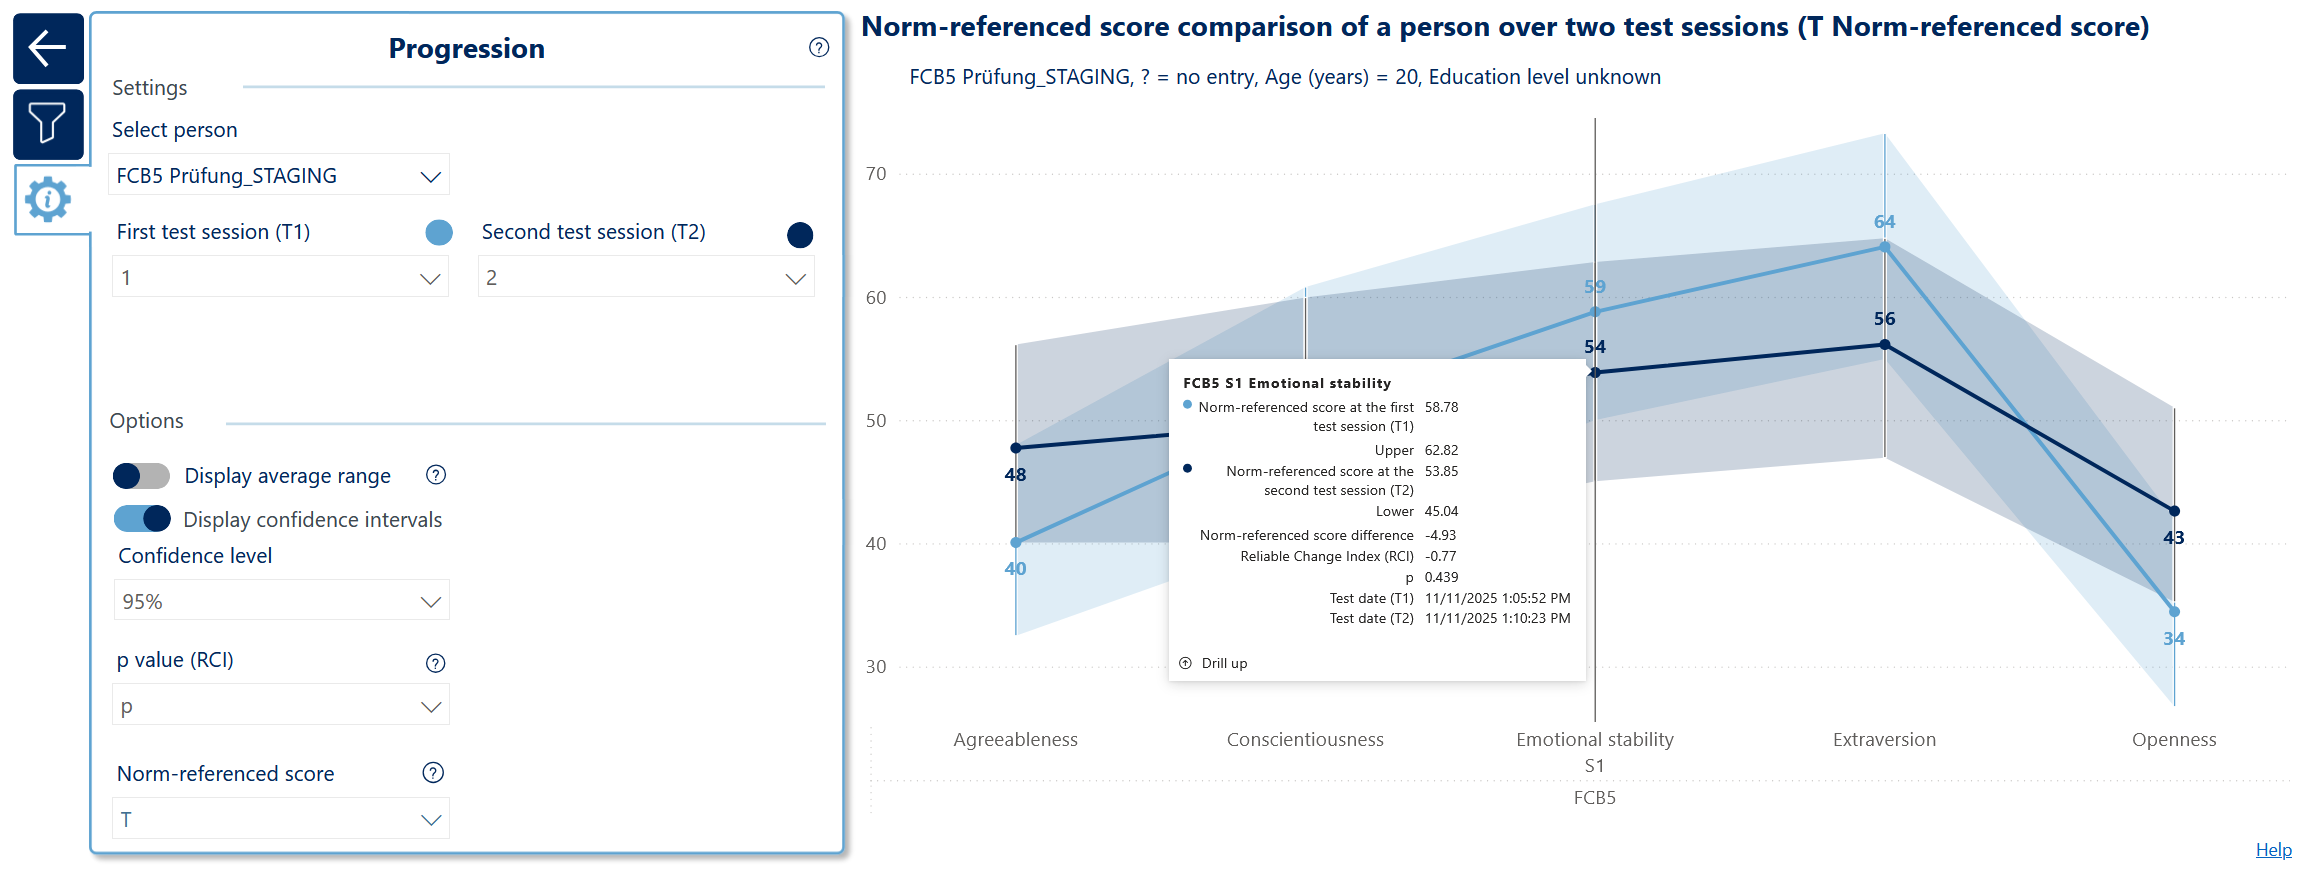
On this page you can compare the norm-referenced scores of a person at two test sessions. Move the mouse over the graph to display the score difference between test sessions, the Reliable Change Index (RCI), its p-value, and the test date of each test session. Confidence intervals are based on test reliability (see also Person comparison | Norm referenced score confidence interval scaling)
You have to select one person in “Settings and information” with two test sessions in order for data to be displayed.
Please note that parallel test forms are treated as a single form on this page to ensure fair comparisons with respect to time-of-measurement effects. This means, for example, that:
-
The first test administration of Person A on TMT-S, Form S1 or Form S2 can be compared with the second test administration of Person A on TMT-S, Form S1 or Form S2 (parallel forms).
-
The second test administration of Person A on TACO, Form S1 or Form S2 can be compared with the third test administration of Person B on TACO, Form S1 or Form S2 (parallel forms).
-
However, the first test administration of Person A on TACO, Form S1 (Concentration Ability) cannot be compared with the second test administration of Person B on TMT-S, Form S3 (Sustained Attention).
Calculation of the Reliable Change Index (RCI)
The Reliable Change Index is used to determine whether the change in a person’s test score between two test sessions exceeds what would be expected based on measurement error:
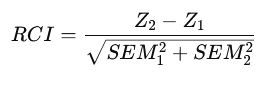
where
-
Z1 = standardized score (z-score) at time point 1
-
Z2 = standardized score (z-score) at time point 2
-
SEM1 = standard error of measurement at time point 1
-
SEM2 = standard error of measurement at time point 2
The standard error of measurement is derived from the 95% confidence interval of the test score exported from VTS online
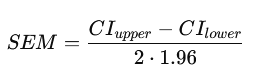
where lower and upper bound of the 95% confidence interval are Z values, irrespective of the norm-referenced score type chosen by the user, which is only used to display the absolute norm-referenced score differences.
The selected confidence level and hypothesis type (one or two-sided) determine only the significance threshold pcrit for visualization:

Changes are classified as significant if p < pcrit and not significant if p ≥ pcrit.
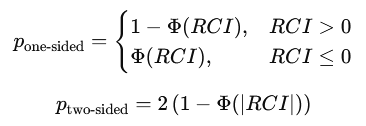
The p-value is calculated from the RCI assuming that the RCI follows an approximately standard normal distribution under the null hypothesis of no change: