What patterns emerge in test performance?
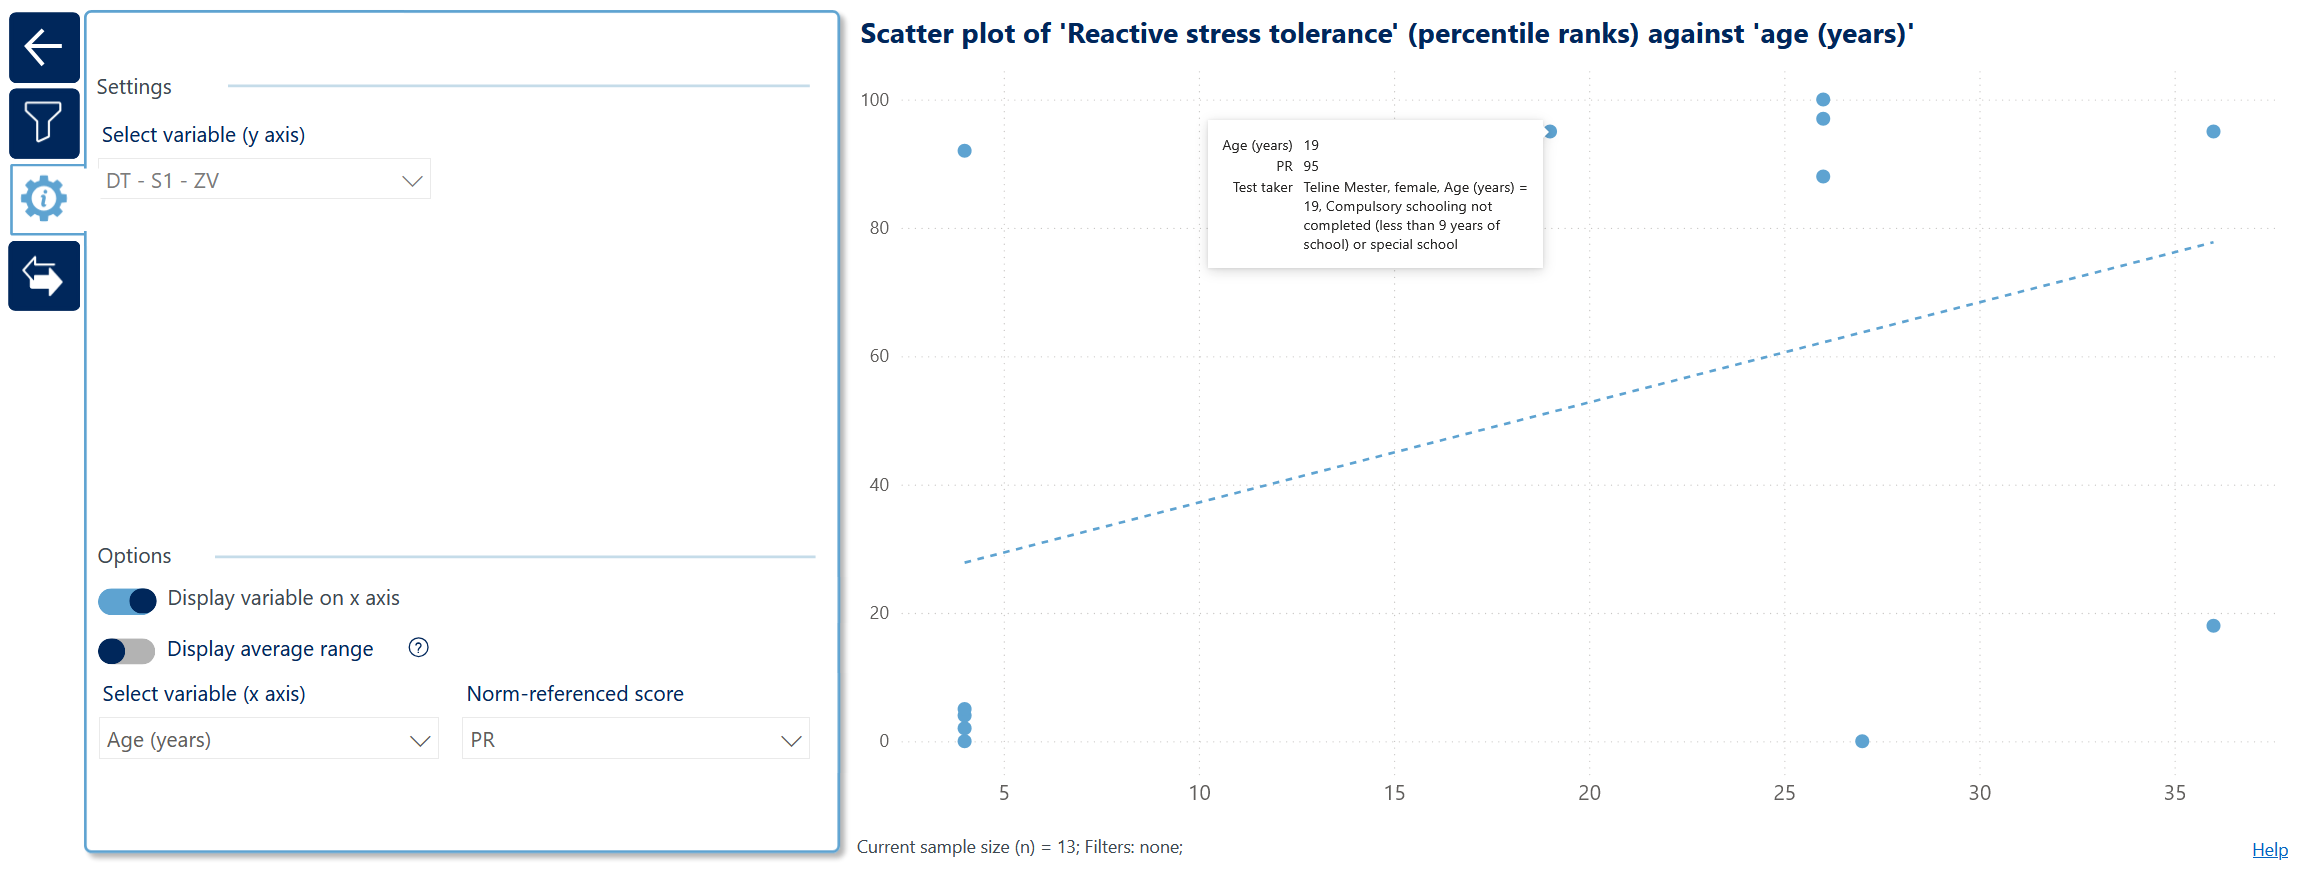
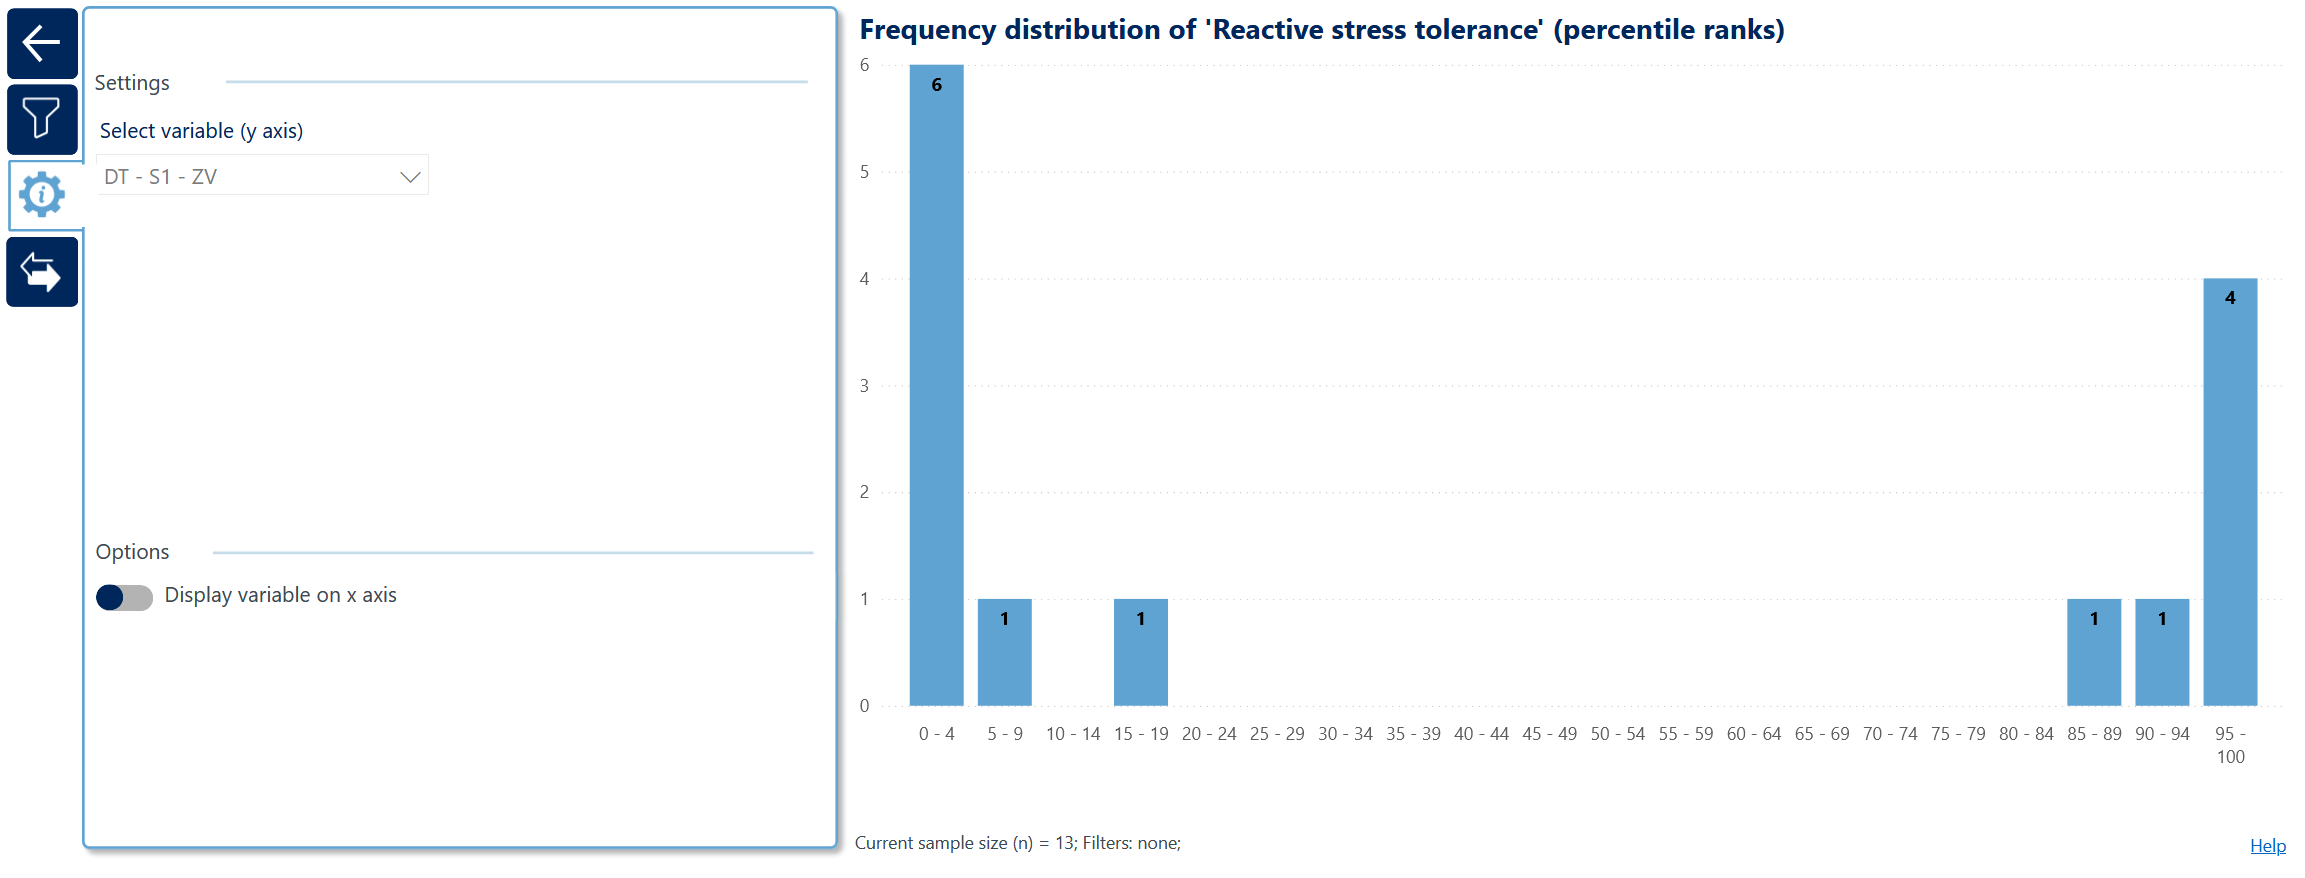
On this page, you can explore the distribution of test scores (histogram) as well as relationships with demographic variables or test duration (scatter plot).
For the scatter plot, you can additionally select the variable displayed on the x-axis. Hover over a data point to view the demographic characteristics of all individuals represented by that point. If gender or education level is displayed numerically, hover over the x-axis to view the corresponding value legend. The trend line serves as a descriptive visual aid and should be interpreted with caution. Meaningful interpretation is only possible when interval-scaled norm scores are displayed on the y-axis (Z, T, or IQ scores, but not percentile ranks) and a metric variable is displayed on the x-axis (age or test duration). It should not be interpreted when the x-axis represents numerically coded categorical variables such as gender or education level.
Interactive highlighting (