General notes on evaluation
By using SFS Test Solutions, users benefit from a joint results report that summarizes the test results of all tests included in the test sequence in a single result. This integrated scoring enables efficient and transparent interpretation, as all test results are accessible at a glance.
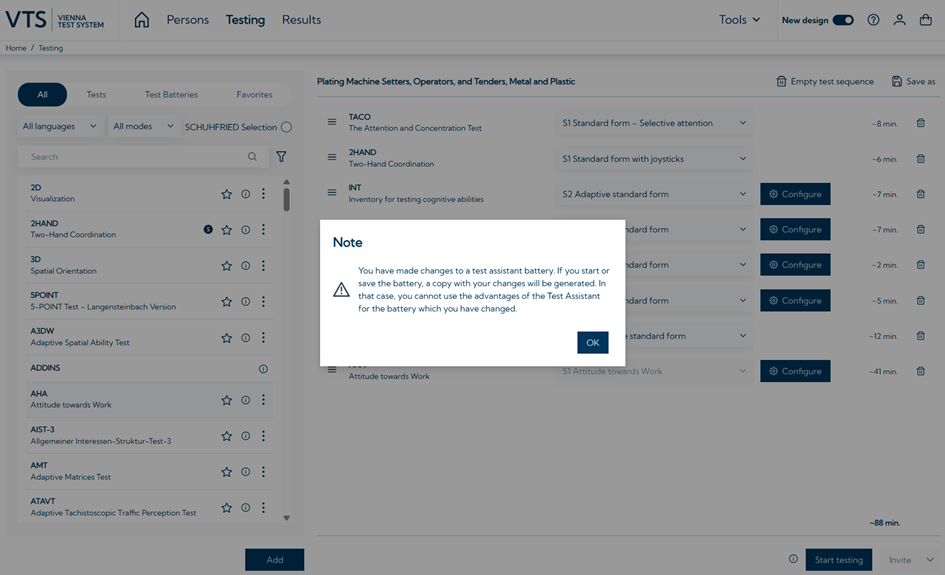
However, users should inspect the results of the individual tests and take them into account when interpreting the results, as they may contain additional information that influences the interpretation (e.g. relevant subsidiary variables that provide information about the number of errors made when working the test). In VTS, you can easily switch between the different types of result display (see the following screenshot).

Please note that if the predefined test sequence is changed or tests that are not part of the SCHUHFRIED Selection are added, this joint results report will no longer be available automatically. The figure below shows a warning message that is displayed if the configuration of a test solution is changed.
Extended scoring with overall scoring
For certain test solutions, a supplementary overall scoring is available in the joint results report. The overall scoring indicates how well the respondent matches an ideal profile. Test solutions that have such an overall scoring are marked with this icon: ![]()
The overall scoring represents a general, cross-dimensional evaluation calculated from the results of the presented individual tests. To this end, the results in the main variables are z-standardized, weighted, and aggregated into an overall score. Higher percentile ranks in the individual tests always lead to a better fit with the ideal profile.
The weightings of the individual tests are based on empirical studies or scientific findings on the relevance of the tested dimensions for the respective application (the diagnostic question to be answered). In addition, international or professional guidelines are taken into account when determining the relevance of the individual dimensions for certain applications. The weightings for the individual dimensions differ depending on the use case. Which weightings are used and how they were determined is described in the documentation for the individual test solutions (see: Test Solutions).
The overall rating is illustrated in the form of a graph for a quick overview. The center of the graph shows the match to the ideal profile (expressed as a percentage), with higher values indicating a better match. The extent of the match is shown in the graph.
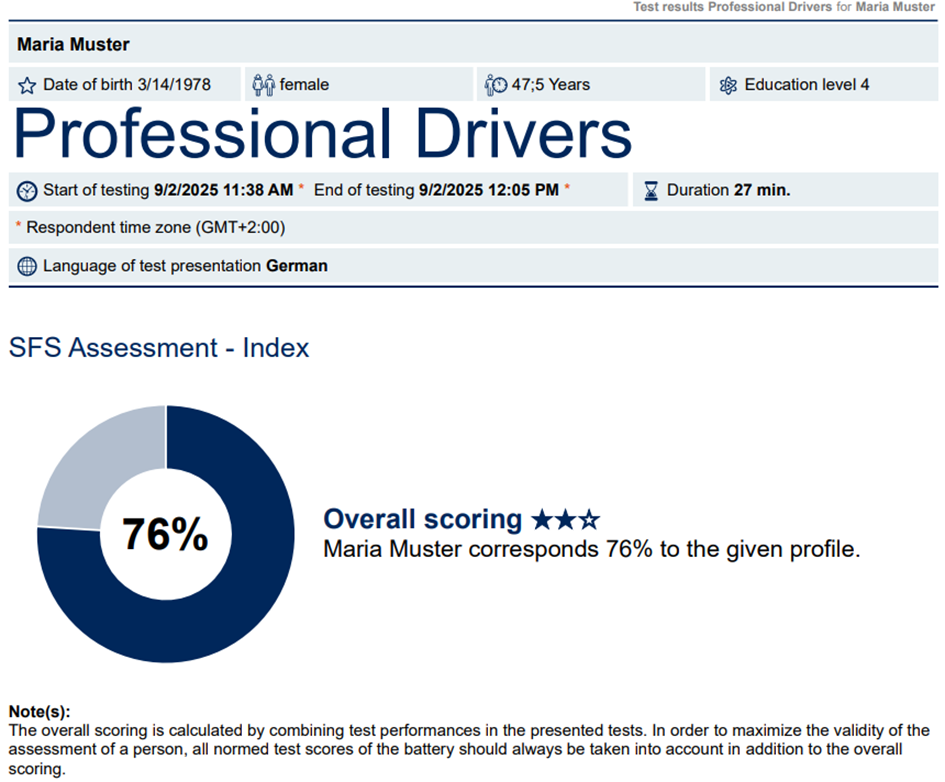
In addition, for ease of interpretation, the overall scoring, i.e., the fit to the ideal profile, is displayed using a categorization (“star rating”). There are three possible categories (1, 2, or 3 stars). The criteria for each category are listed in the table below. To achieve 3 stars, for example, the respondent's overall score must be above 89 (i.e., 90% or more).
|
Number of stars |
Interpretation |
Overall score |
|---|---|---|
|
3 stars |
The test taker's result represents an excellent match to the ideal profile. |
> 89 |
|
2 stars |
The test taker's result represents a solid match to the ideal profile. |
45-89 |
|
1 star |
The test taker's result represents a moderate match to the ideal profile. |
< 45 |
The selected cutoffs for the three categories are based on the established average ranges used for interpreting individual test results in the field of aptitude testing. The cutoff for 3 stars correspond to an overall rating of 90. This value was chosen so that it corresponds approximately to an average percentile rank of 75 in all dimensions included in the overall rating. Accordingly, the cutoff value for 1 star was chosen to correspond to an average percentile rank of 25 in all dimensions included in the overall rating.
One characteristic of this overall assessment is that a single dimension may be well below average, but still result in a high overall assessment. This may influence the interpretation (e.g., whether a person is suitable for a particular profession) if the dimension is highly relevant. If this is the case, a corresponding note will be included in the results report.
In order to form as valid a judgment as possible based on the test results, all individual test results should always be taken into account in addition to the overall assessment. To make this easier, the performance in the individual tests is indicated at the dimension level for all test solutions that issue an overall rating, using a simple color scheme (traffic light system: red-yellow-green). Details can be found in the following section.
General notes on interpretation
Test results are usually interpreted using percentile ranks. The percentile rank indicates what percentage of a specific comparison group has a lower or equal score in this performance or personality trait. A representative sample from the total population is generally used as the comparison group. If this is not the case, this is explicitly stated in the evaluation. For example, a percentile rank of PR = 76 means that 76% of the test takers from the representative standard sample have a lower or equal score and 24% have a higher score in this performance or personality trait.
-
A percentile rank of up to 24 indicates a below-average score for the relevant performance or personality trait compared to the representative norm sample.
-
A percentile rank of 25 to 75 indicates that the performance or personality trait in question is average compared to the representative norm sample.
-
A percentile rank of 76 or above indicates an above-average level of the relevant performance or personality trait compared to the representative standard sample.
In the SFS Test Solutions a simple color scheme (traffic light system: red-yellow-green) is used to indicate performance in the individual tests.
-
A red mark on a test result indicates that a test taker has performed significantly below average. The threshold value corresponds to a percentile rank of 15.

-
A yellow marking on a dimension indicates a slightly below-average performance by a test taker. The threshold value corresponds to a percentile rank of 25.

-
Dimensions marked in green indicate an average performance by the test taker. Here, the test taker achieved a percentile rank in the range of 25 to 100.

The traffic light system is currently available only for SFS Solutions with extended scoring ![]()
![]()
![]()
the traffic light system is currently not available for Solutions for occupations based solely on a requirements analysis
In addition to comparing the test results with the norm sample, the individual profile should be taken into account when interpreting all test batteries in order to identify individual strengths and areas for development.
In addition, confidence intervals can be taken into account in the interpretation. The confidence interval takes into account the measurement accuracy (reliability) of a test and is a defined range (around the measured test score) within which the true value of the performance or personality trait lies with a certain probability (usually 95%). The confidence intervals are included in the results report by default.
The standard scoring provided by SFS Test Solutions offers a joint result report. However, this does not show all the details that are available in the individual test results. Warnings and detailed information that are output in the test protocols are not displayed in the joint result report, for example. Therefore, the individual test results and the corresponding test protocol should always be taken into account when interpreting the results.
At the level of individual test results, it is possible to check whether the testing was conducted as expected or whether, for example, any anomalies occured during testing. These could include, for example, an above average number of errors, which could indicate comprehension difficulties in completing the tasks, very short or long working times or conspicuous response patterns.
To verify this, the test protocol of individual test results provides information at the item level. This allows you to track which answer options were selected, how they were evaluated (e.g., correct or incorrect), and the working times.
The joint results report and, if applicable, the overall scoring should only be used to form an opinion after the individual test results and test protocols have been checked to ensure that the testing was carried out correctly.
Feedback to the test taker
The aim of the feedback talk is to provide those affected with appropriate information about the results of the diagnostic process in a transparent, respectful, and objective manner. The feedback should therefore provide information about the objectives of the testing, the assessment procedures used, and, if applicable, additional information that was taken into account in the final assessment. The methodology of the procedures used should be explained in a comprehensible manner and the content collected and, if applicable, the relevant theories should be explained in a way that is understandable to laypersons. The results of the assessment should be explained objectively and without bias. All questions and follow-up questions from the candidates should be answered adequately. In addition, the respondent's feedback on the testing should be taken into account (e.g., whether all tasks were understandable).
For this reason, sufficient time should be allowed for the feedback discussion. In practice, it is advisable to ensure an open and trusting atmosphere for the feedback discussion by introducing a few words. Even below-average test results should be communicated openly, but with the necessary sensitivity, so that intra-individual strengths as well as areas for development can be highlighted. In addition, test takers should be informed about possible influencing factors that may affect the test results, such as their condition on the day (tiredness), nervousness during testing, or similar.
In personnel selection, it is not always advisable to pass on the results to the test takers in written form without comment, as the results could be misinterpreted. Even if the results reports contain extensive information and explanations for the candidate, questions may still arise. The candidate should be informed that they are welcome to take notes during the feedback meeting. In the case of potential analyses, however, it may be useful to provide the candidate with a written, verbalized summary of the results.
The test results constitute sensitive personal data and should be treated in accordance with applicable data protection guidelines (e.g., GDPR).