
This example illustrates how VTS Analytics can support cognitive rehabilitation and longitudinal monitoring of patients.
You are a neuropsychologist working in a vocational rehabilitation center that focuses on cognitive rehabilitation following stroke, traumatic brain injury, or substance use disorder. To assess the neurocognitive level of functioning, you use the SFS Test Solutions Substance Use Disorders - Neurocognitive Assessment and Brief Neurocognitive Assessment as a basic screening of neurocognitive domains. Depending on the patient’s anamnesis, you may add additional tests to further assess specific cognitive functions.
The individual cognitive profile of a patient can already be reviewed in the test result report. However, you decide to use VTS Analytics to compare the patient’s results not only with the normative reference population but also with the average performance of patients with the same diagnosis in your clinic.
To enable this comparison, you enter the diagnosis code as a Scoring Code during data collection.
Comparing the Patient with the Clinical Sample
After testing, you open Reference group comparison in VTS Analytics. In the Settings panel, you select the individual patient whose results you want to analyze.
Next, you restrict the comparison sample by applying filters. Under Filters, you limit the dataset to:
-
patients from your clinic
-
the relevant demographic group
-
the corresponding diagnosis group
You then activate Show confidence intervals in the Settings panel and select T-scores as the norm-referenced score metric. T-scores are normally distributed with a mean of 50 and a standard deviation of 10, which allows for appropriate statistical comparison between an individual and a sample average.
The results are shared with the physicians and psychologists involved in the patient’s therapy. This allows them to see how the patient performs not only relative to the norm population, but also relative to the clinical population typically treated in the center. such comparisons provide therapists with clinically relevant reference points for their everyday clinical work.
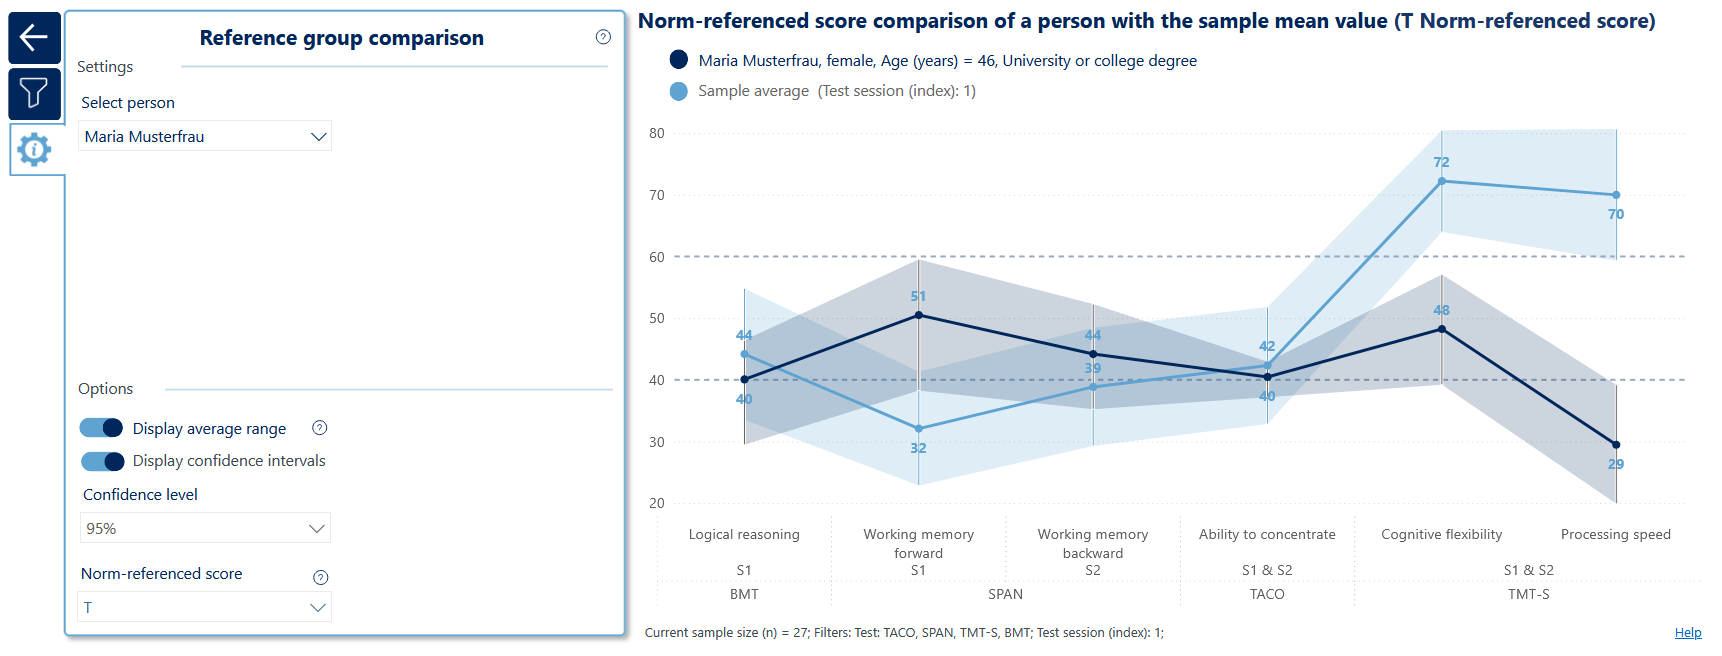
The analysis shows that the patient's performance in short-term memory (SPAN S1) is approximately equivalent to the mean of the normative population. Compared with the clinic's typical patient population, however, performance is above average. Taking sample size and test reliability into account, this difference is not statistically significant.
In cognitive flexibility, the patient also performs within the average range of the normative population, whereas the clinic's typical patient population tends to achieve above-average scores. The confidence intervals do not overlap, indicating a statistically significant difference.
Processing speed is two standard deviations below the mean of the normative population, and even the confidence interval, taking measurement precision into account, remains below the average range.
Monitoring Cognitive Progress Over Time
After a period of therapy, the patient is tested again to monitor possible improvements.
To evaluate changes in performance, you open Progression in VTS Analytics and again select the patient in question.
To determine whether the observed changes in processing speed are statistically meaningful, you hover over the data points for “Processing Speed”. The displayed information includes the Reliable Change Index (RCI), which takes the reliability of the test into account.
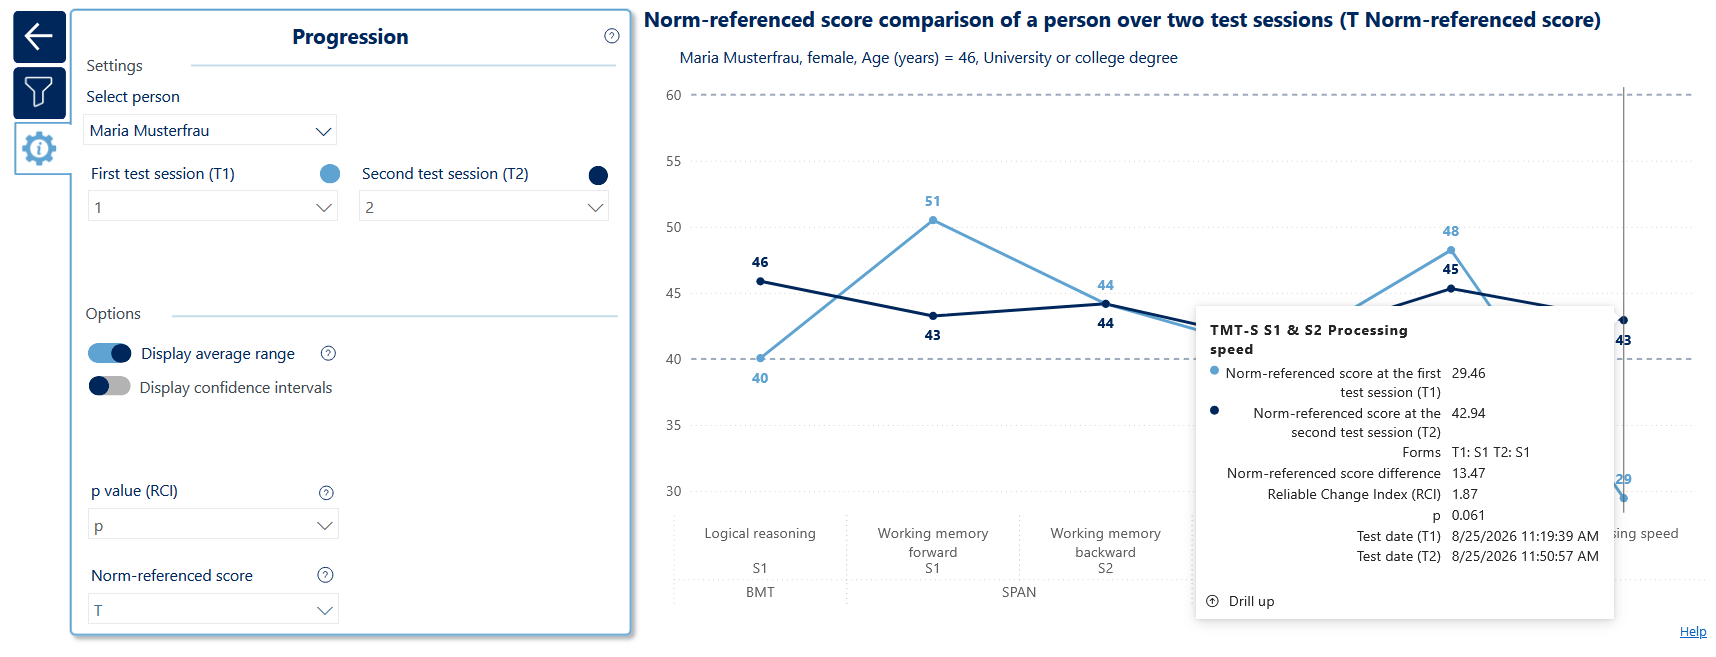
At a significance level of 95% with one-sided testing, that is, when specifically testing for improvement, the observed improvement of 22 T-score points narrowly fails to reach statistical significance.
These results provide an objective basis for evaluating the patient's cognitive recovery during rehabilitation and can be incorporated into the final clinical documentation.